NCREIF Farmland Property Index 2022 2nd Quarter Results

Peoples Company is a member of NCREIF and actively monitors the quarterly Farmland Index results. This article reports a summary of 2nd Quarter 2022 NCREIF Farmland Index returns on a total and regional basis; a breakdown of permanent and annual cropland is included. It compares those returns (on a 1-year basis) to the annualized return of each category since inception. Most regions report data/analysis as far back as 4th Quarter 1990. As such, some of the annualized returns ‘since inception’ are based on roughly 32 years’ worth of data.
Overview
NCREIF Farmland Property Index 2022 2nd Quarter Results:
“The NCREIF All Farmland Properties Report represents data collected from the Data Contributing Members of the National Council of Real Estate Investment Fiduciaries (NCREIF). Such data, once aggregated, may not be representative of performance of the farmland property universe. In addition, the data is limited by the data collection process, including NCREIF’s changing membership and changing member portfolios. Membership requires that all eligible properties be reported.
The quarterly detail report now includes individual permanent cropland (eg. almonds) returns and given the potential variability in crop sale timing and cultural care practices, such returns may be better evaluated over periods extending beyond one year.”
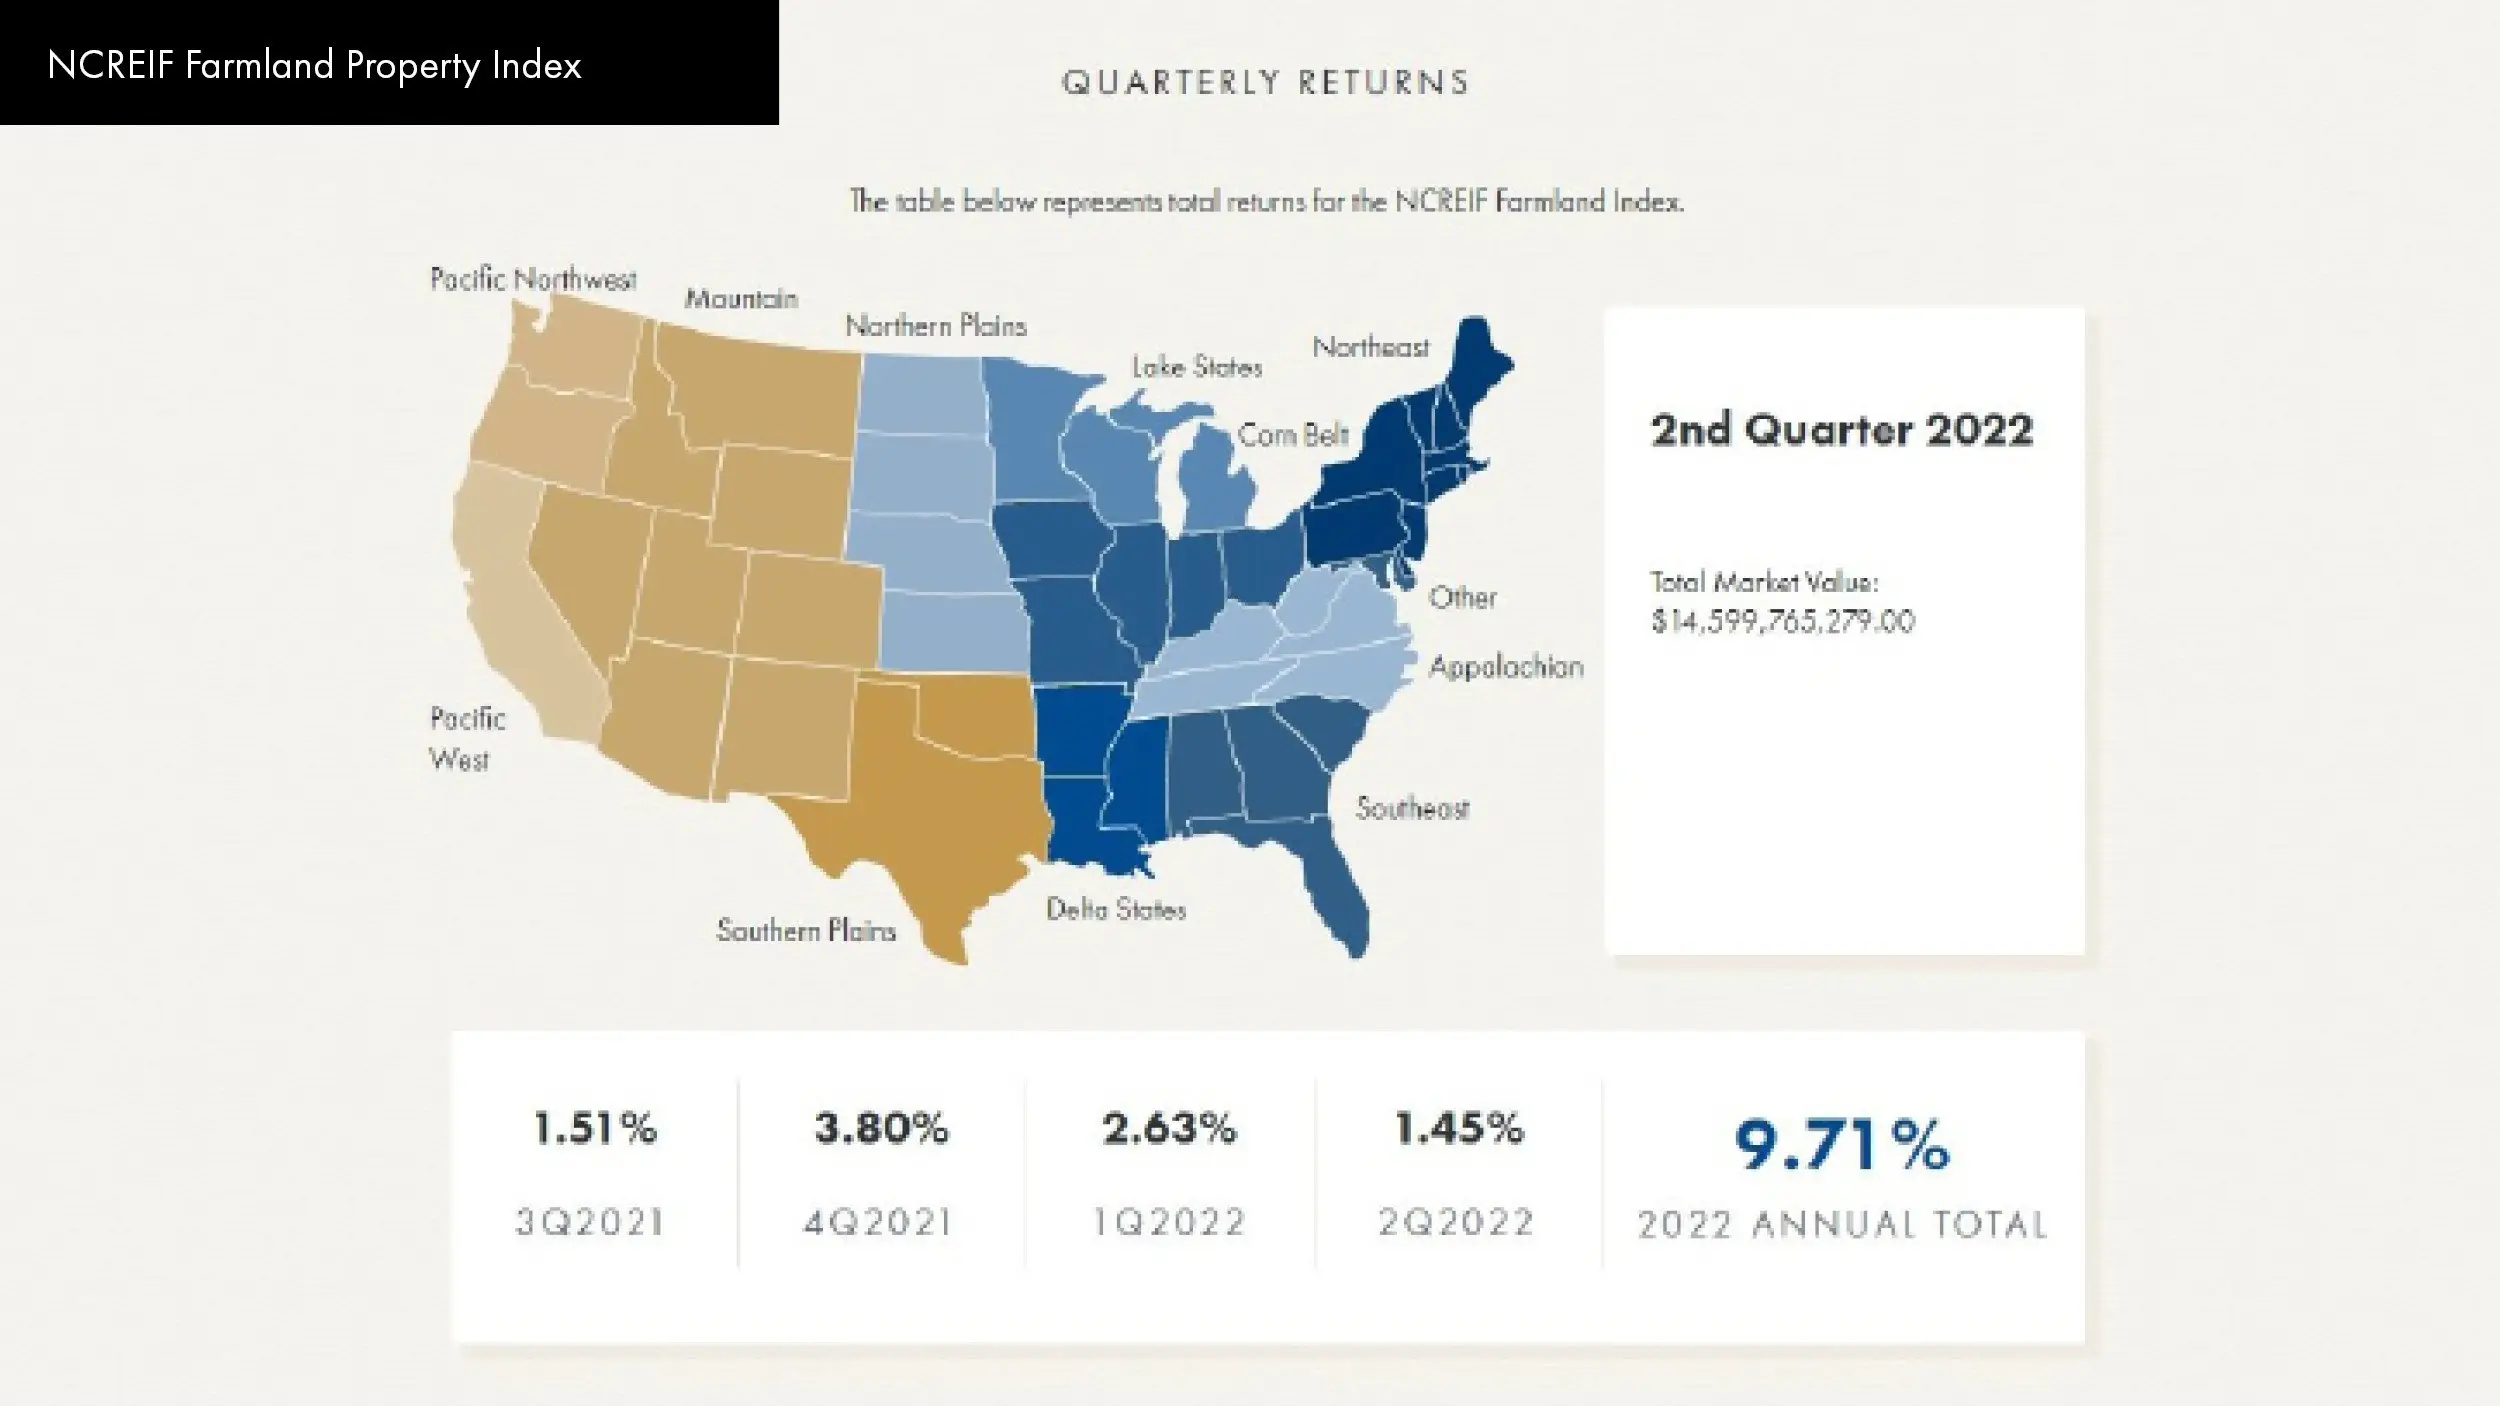
NCREIF Submarket Map
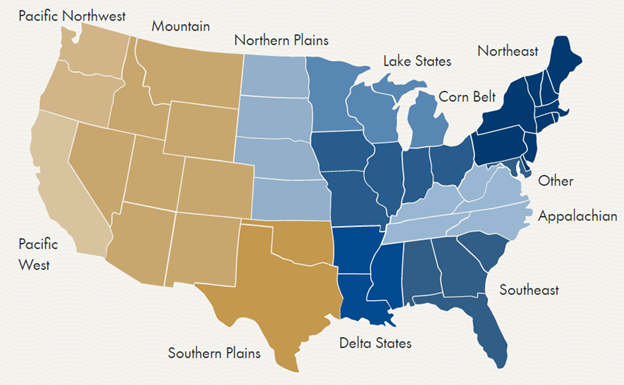
- Pacific West – California
- Pacific Northwest – Oregon, Washington
- Mountain – Arizona, Colorado, Idaho, Montana, Nevada, New Mexico, Utah, Wyoming
- Corn Belt – Illinois, Indiana, Iowa, Missouri, Ohio
- Lake States – Michigan, Minnesota, Wisconsin
- Southeast – Alabama, Florida, Georgia, South Carolina
- Delta States – Arkansas, Louisiana, Mississippi
- Appalachian – Kentucky, North Carolina, Tennessee, Virginia, West Virginia
- Northern Plains – Kansas, Nebraska, North Dakota, South Dakota
- Southern Plains – Oklahoma, Texas
- Northeast – Connecticut, Delaware, Maine, Maryland, Massachusetts, New Hampshire, New Jersey, New York, Pennsylvania, Rhode Island, Vermont
Comparative Schedule of Recent Quarterly and 2022 Annual Total Return
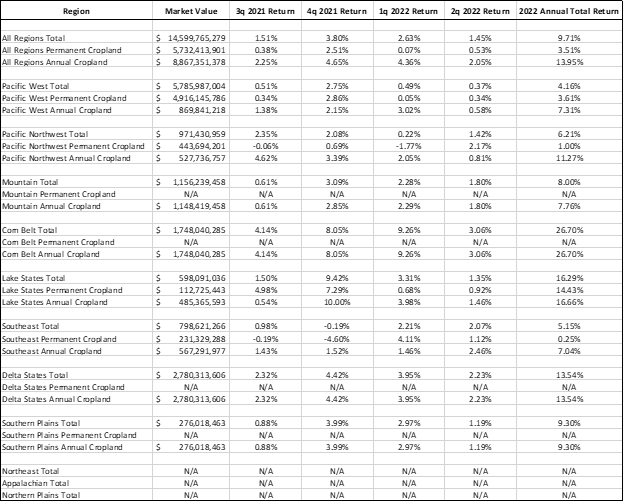
Source: NCREIF Farmland Property Index 2q2022
The 2nd Quarter Total Data includes analysis of 1,300 properties with an aggregate market value of roughly $14,600 million. The 2nd Quarter Annual Permanent Cropland Data includes 319 properties with an aggregate market value of roughly $5,732 million; the 2nd Quarter Annual Cropland Data includes 981 properties with an aggregate market value of roughly $8,867 million.
1-Year Return v. Annualized Return Since Inception
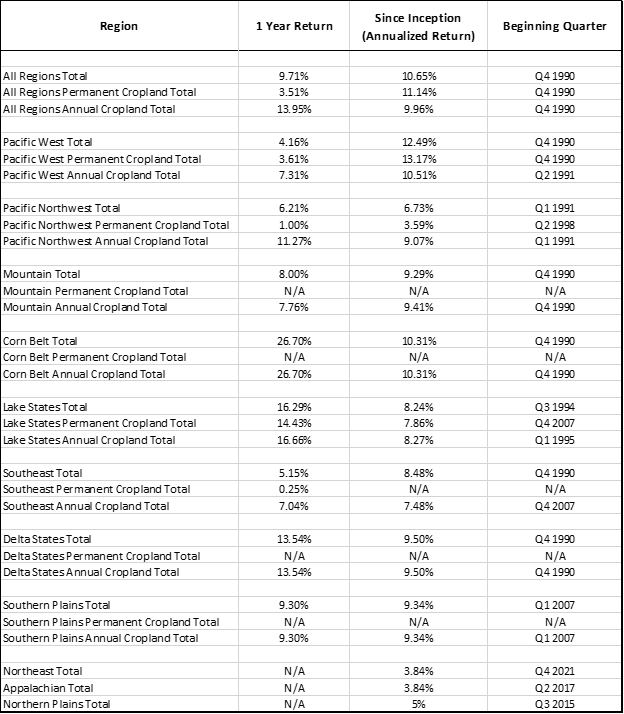
Source: NCREIF Farmland Property Index 2q2022
The chart above compares the most recent 1-year return to the annualized returns since inception. Note that most of the data presented for annualized return since inception started in Q4 1990.
Corn and soy commodities are trending at a 10-year high – as such, Corn Belt 1-year annual return indicates the strongest returning submarket within the set. Lake States and Delta States followed in second and third with a respective return of 16.29% and 13.54%. Other metrics of note include All Regions. All Regions total is relatively consistent with 9.71% compared to 10.65%. However, Permanent Cropland in All Regions has a historic run since inception well above its more recent 1-year run, while Annual Cropland in all Regions has had a stronger 1-year run relative to its historic run since inception.
Farmland Returns v. Alternative Investments
Farmland is widely known as one of the most secure real estate investments available. The metrics presented in the Farmland Index can be compared to other known investments with similar risk levels. An investor or market participant can invest their money anywhere; and two of the most important considerations are level of risk and level of return. In this case, farmland returns are compared to the current 10-year treasury rate, and the annual average return of the S&P Index since 1990.
As of the date of this blog being published, the 10-year treasury rate is roughly 4.00%. Furthermore, as of the date of this blog, the annual return of the S&P Index since 1990 is roughly 9.84% per year. When comparing these metrics to the Farmland Index metrics, All Regions Total, All Regions Permanent Cropland Total, and All Regions Annual Cropland Total have returns 10.65%, 11.14%, and 9.96%, respectively since Q4 1990.
Most of the major submarkets indicated by the Farmland Index have performed on par (some slightly lower and some slightly higher) than that S&P Index since 1990. While not entirely similar investments, farmland has proven to be a strong alternative to investment in the S&P Index and largely superior to investment in 10-year treasuries.
On a purely return standpoint, the risk comparison is apparent; however, investment in real estate such as farmland does carry additional considerations such as liquidity, capital gains, ability to leverage, and anticipated length of holding term.
Conclusion
Peoples Company is a member of NCREIF and actively monitors the quarterly Farmland Index results. The data is used/considered in their appraisals as a metric to help reconcile accurate opinions of market value. The returns indicated are published by NCREIF and are not the property of Peoples Company. Furthermore, as with any metric utilized in an appraisal report, the data needs to be considered. The Addenda section noted below includes Methodology and Universe of Properties bullet points identifying the particulars of the data used in the NCREIF Farmland Index.
Peoples Company is excited to expand our reach to provide top performance for landowners in all regions. Peoples Company employs an appraisal staff well versed in the valuation of agricultural assets. The team covers a wide range of agricultural market across the United States and has achieved several of the highest-level designations in the industry. If you are interested in discussing the value of your agricultural asset, please reach out to Appraisal@PeoplesCompany.com or call 855.800.5263.
Addenda:
The verbiage below is sourced directly from the NCREIF Farmland Property Index 2022 2nd Quarter Results:
Methodology
·Calculations are based on quarterly returns of individual properties before the deduction of fund or portfolio-level asset or investment management fees.
· Each property’s return is weighted by its market value.
· Income and Capital changes are also calculated.
Universe of Properties
· All properties have been acquired, at least in part, on behalf of tax-exempt institutions and taxable institutions and held in a fiduciary environment.
· All properties are reported on an all-cash, unleveraged basis.
· Only agricultural properties.
· Wholly owned and joint venture investments.
· Existing properties only.
· The database may increase quarterly as participants acquire properties on an all-cash basis and as new members join NCREIF.
· Sold properties are removed from the report in the quarter the sales take place (historical data remains).
· Each property’s market value is determined by real estate appraisal methodology, consistently applied.
Agriculture
Crop Insurance
Energy Management
Industry Insights
Land Auctions
Land Investment Expo
Land Management
Land Values
News & Events
Real Estate


Peoples Company proactively works to anticipate the needs of those in the agricultural sector. Our monthly email publication keeps readers in the know about everything land.
