Iowa Agricultural Market Analysis

By Lucas Riesenberg, Agricultural Appraisal Intern
Iowa Demographics
According to the United States Census Bureau, the population of Iowa is approximately 3,193,079 or 54.5 people per square mile as of July 2021. The median household income was $60,523 or $32,176 per capita in 2019. The poverty rate is 10.2%, and the median owner-occupied home value is $147,800. There are a total of 1,265,473 households with an average of 2.40 people per household.
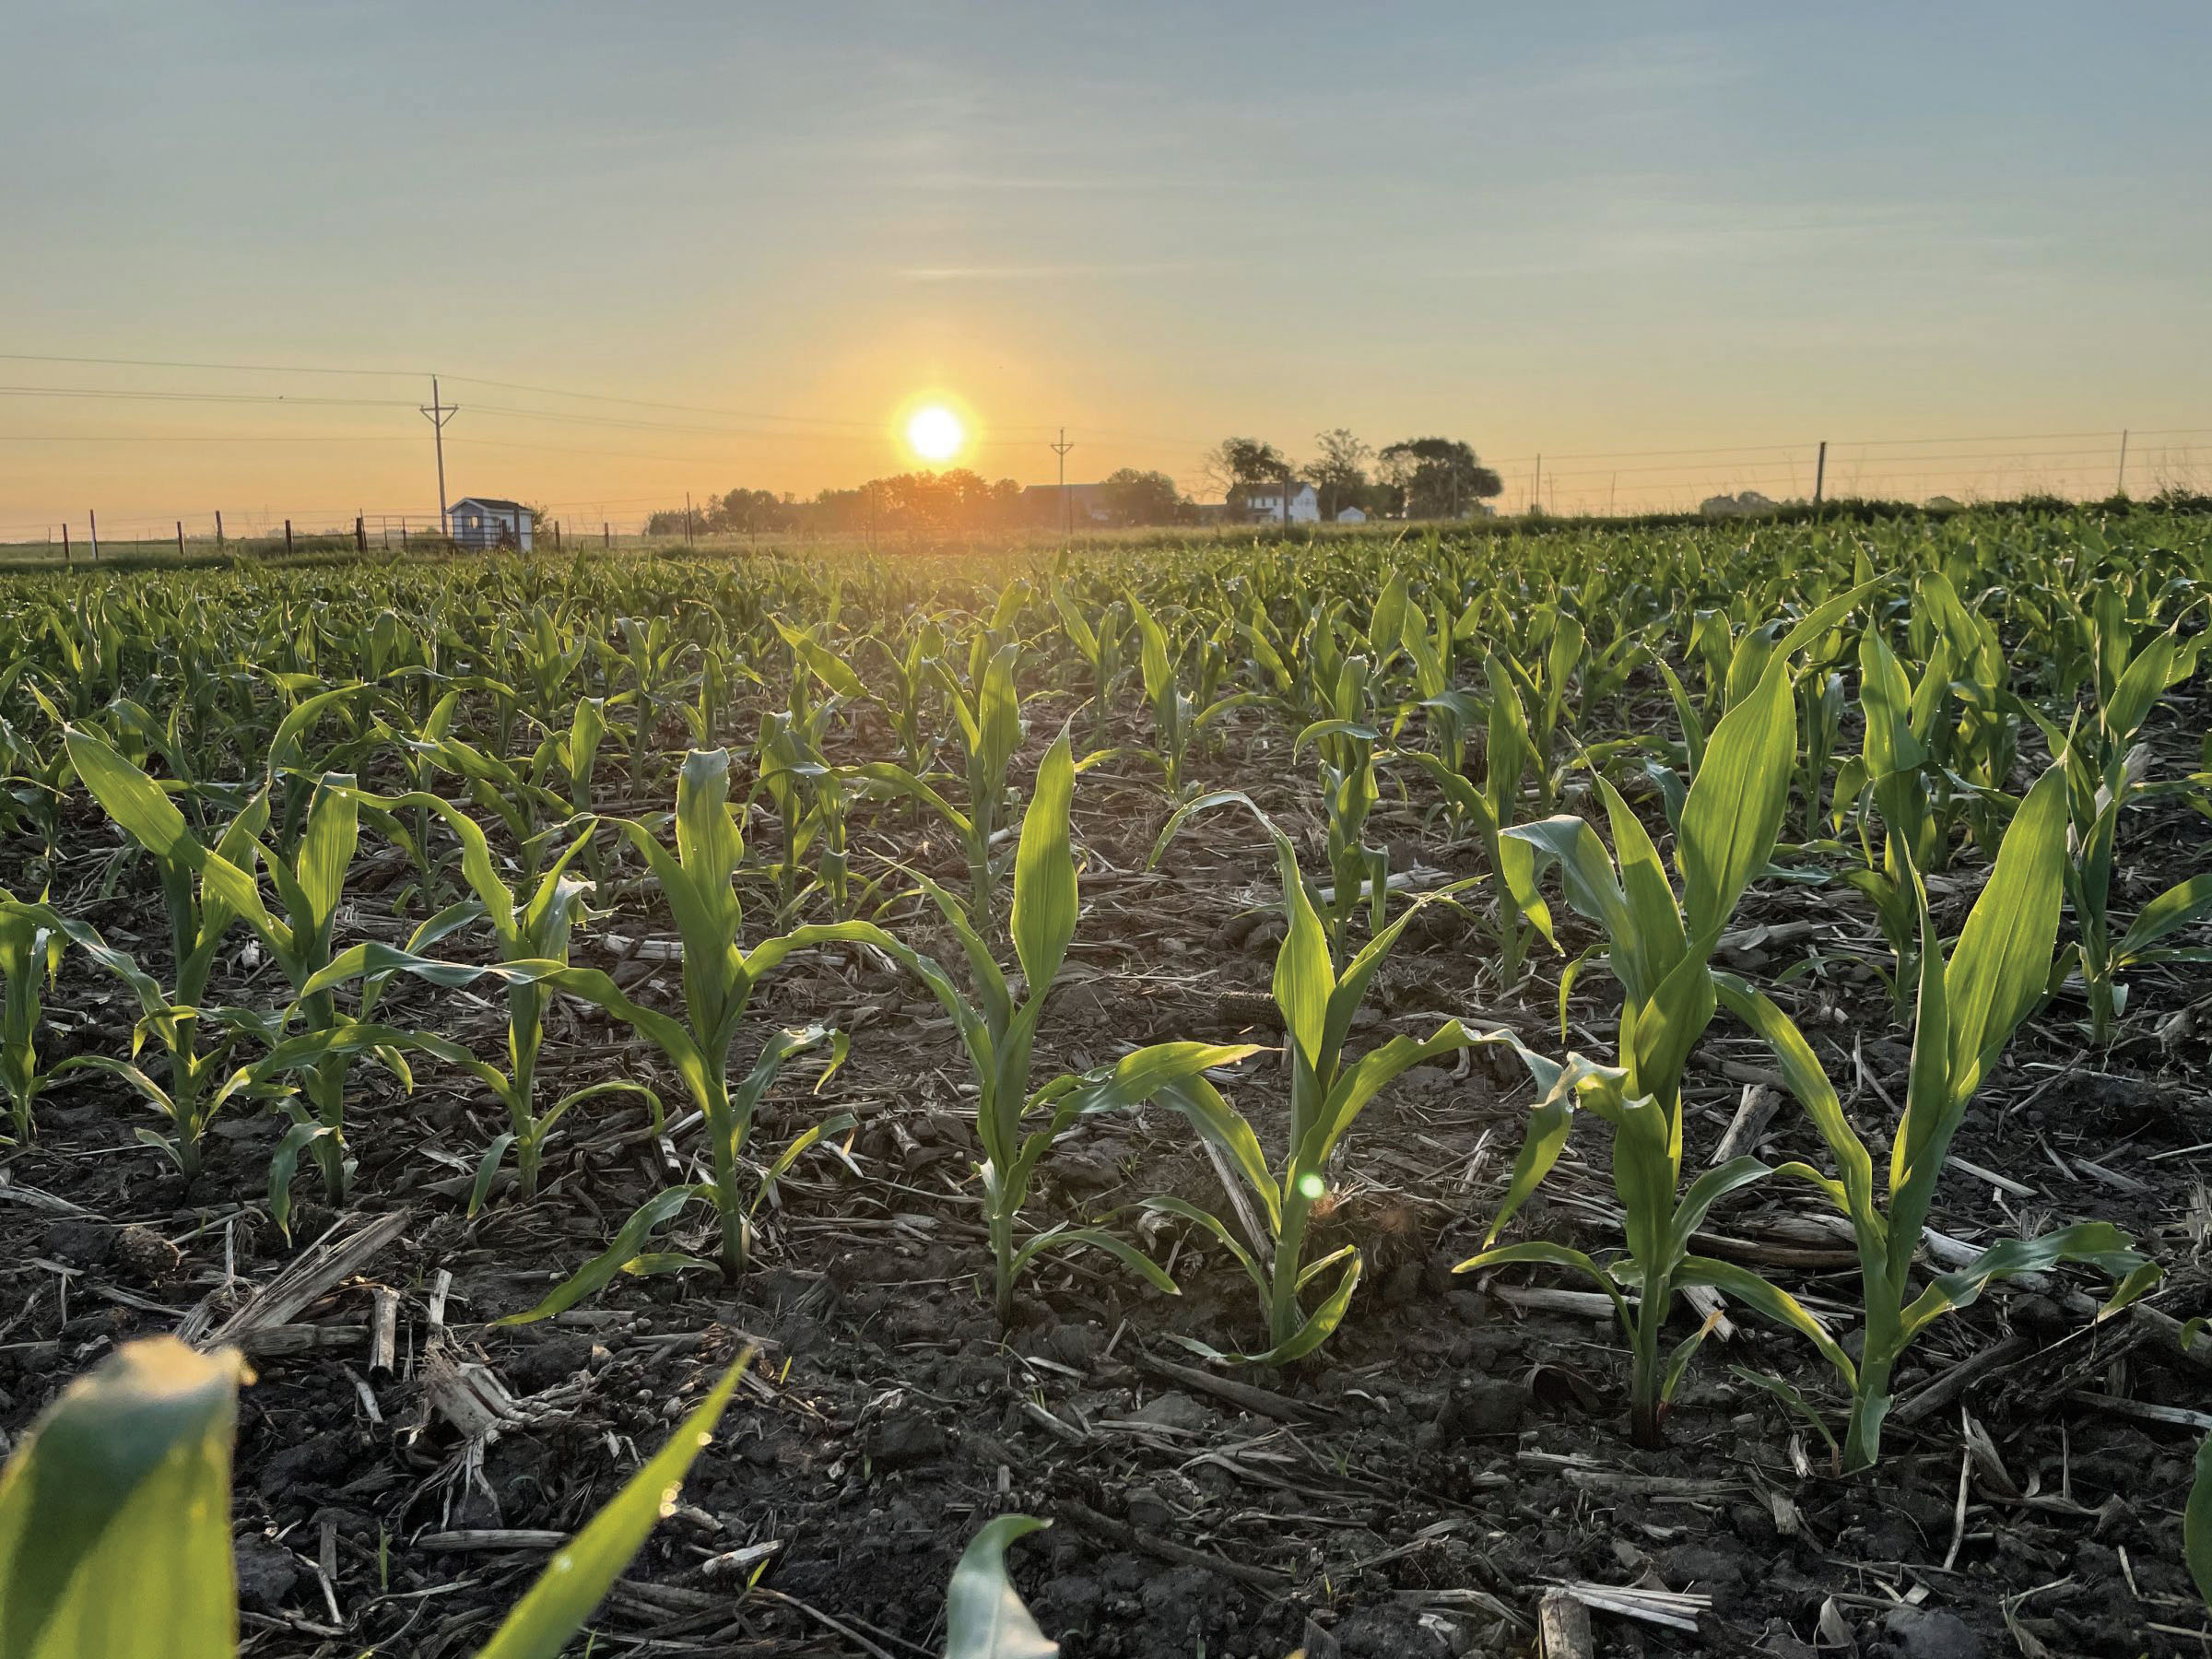
Iowa Geography and Climate
Iowa is made up of 55,857 square miles and sits between the Missouri and Mississippi Rivers. Flat plains and rolling hills primarily cover the state. The continental ice sheets that covered the land long ago created Iowa's terrain and rich soils. Iowa is a four-season state with cold winters averaging 14-20 degrees Fahrenheit in January and warm, humid summers averaging in the mid-80's in July. Occasionally the temperature will reach 100 degrees in the summer. Precipitation varies across the state, with the southeast portion receiving nearly 38 inches and the northwest portion averaging 26 inches of precipitation per year. Most of the precipitation is in the summer and spring seasons. In previous years, snowmelt and spring rains have led to flooding in some areas, delaying spring planting for some farmers.
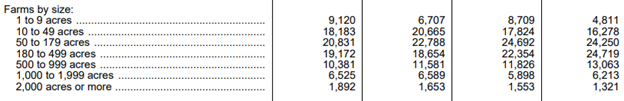
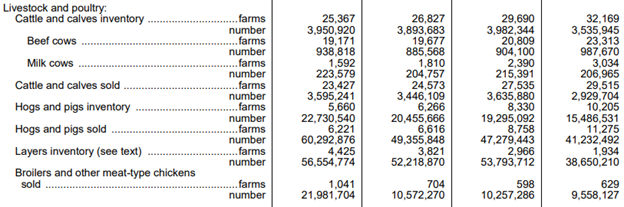
Iowa Census of Agriculture
The Census of Agriculture provides data about U.S. farms and ranches every five years. It is the leading source of agricultural demographic data for every State and county or county-equivalent. The survey indicates that from 2007 to 2017, the number of farms in Iowa decreased by 7.27% to only 86,104 farms and the average acres per farm increased by 6.76% to 355 acres. The number of acres in farms has gone down by 183,672 acres to 30,563,878 total acres. The estimated average market value of land and buildings per farm has increased by 55.24% to $2,506,812 in 2017. The estimated average market value of land and buildings per acre has increased by 52.02% to $7,062 in 2017. From 2007 to 2017, the average estimated value of all machinery per farm has increased by 40.72% to $230,716. The Census of Agriculture tracks the number of farms, acres and bushels that were harvested for each crop type. The number of acres of corn harvested for grain was 12,969,645. These acres were harvested from 44,021 farms producing 2,583,967,870 bushels. There were 4,307 farms that harvested corn for silage or greenchop on 278,370 acres, and 5,525,996 tons were harvested. 40,514 farms harvested soybeans on 9,949,724 acres, producing 553,576,064 bushels of grain. 219 farms harvested winter and spring wheat for grain on 9,086 acres, and 596,005 bushels were produced. There were 2,786,849 bushels of oats for grain harvested on 1,380 farms across 36,580 acres. The number of bushels of barley for grain that was produced was 54,442. This came from 31 farms over 1,157 acres and 54,442 acres. 13 farms had sorghum for grain on 245 acres, producing 25,059 bushels. Sorghum for silage was found on 40 farms and 1,011 acres, producing 14,287 tons.

*Data collection for the 2022 census of agriculture begins in November of 2022
Factors Influencing the Iowa Farmland Market
A survey released in December 2021 by Iowa State Extension and Outreach indicates the major factors influencing the farmland market. The survey includes the opinions of licensed real estate brokers, farm managers, appraisers, agricultural lenders, county assessors, and selected individuals considered to be knowledgeable of land market conditions.
Many survey respondents provided positive and negative factors influencing the Iowa farmland market. Out of all the survey respondents, 94% provided one or more positive factors, and 65% provided one or more negative factors. Many of the survey participants listed multiple factors that were both positive and negative.
Over 10% of the respondents mentioned two positive factors, who provided at least one positive factor. The factor listed the most was higher commodity prices; this factor was mentioned by 28.5% of the respondents. The second and third most listed positive factors were low-interest rates and strong yields, which were listed by 24.4% and 7.4% of the survey participants. Other positive factors that participants mentioned included limited land supply (7%), strong demand, including from investors (6.8%), COVID-related government payments (6.3%), and good farm economy (4%).
Two negative factors were also listed by more than 10% of participants who listed one or more negative factors. 20% of participants mentioned higher input costs, making it the number one listed negative factor. The sustainability of high land prices and possible changes in interest rates were the second and third most listed negative factors, listed by 12% and 8.5% of participants, respectively. Changes in policy, such as tax law changes and concerns with COVID-19, were each mentioned by 5-9% of survey participants.
Value Trends
Farm Credit Services of America
Farm Credit Services of America published a survey on farmland throughout the Midwest. Based on this survey, cropland sales in the fourth quarter of 2021 saw an increase of 36.5% compared to the same period in 2020. The number of public land auctions through the fourth quarter were up 62% compared to 2020. Public land auctions had increased to nearly 50% of all the sales that took place in 2021. This led to a decrease in the number of realtors, private and sealed-bid sales.
Federal Reserve Bank of Chicago
The Federal Reserve Bank of Chicago conducts an annual Agricultural Survey for “good” farmland. The most recent survey indicates that “good” farmland across Iowa increased by 10.00% from July 2021 to October 2021 and increased by 28% from October 2020 to October 2021.
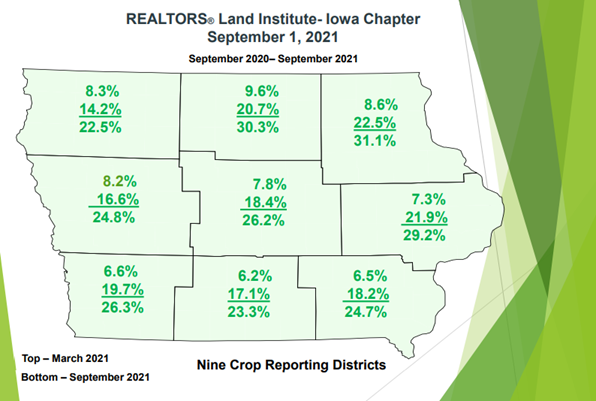
Iowa Realtors Land Institute (RLI)
Per a land survey published by the Iowa Realtors Land Institute (RLI), revised March 2021, land values across Iowa increased by 7.8% from September 2020 to March 2021, and land values across Iowa increased by 18.8% from March 2021 to September 2021. The survey indicates a total increase of 26.6% for land value across Iowa from September 2020 to September 2021.
A breakdown of each of the nine crop reporting districts in Iowa is shown below:
Iowa State University
Iowa State University, Center for Agriculture and Rural Development, and Iowa State University Extension and Outreach publishes an annual survey in November. The 2020 survey estimates that average land values across Iowa have increased 1.7% from November 2019 to November 2020. The 2021 survey estimates a 29% increase in average land values across Iowa from November 2020 to November 2021.

Peoples Company
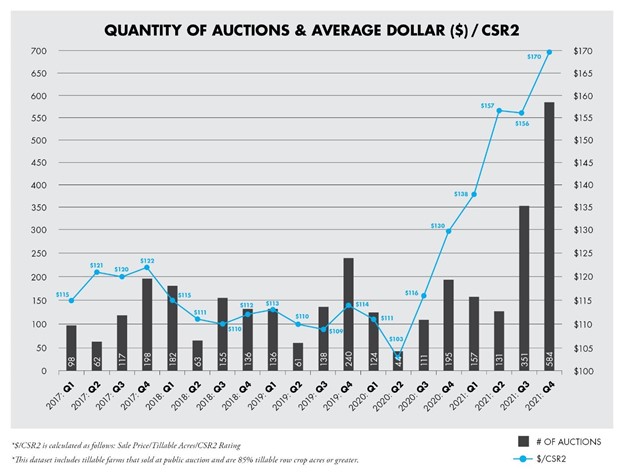
Per information gathered by the Peoples Company appraisal team on actual sales data, agricultural land in Iowa saw a decrease in value from the Fall of 2015 through the Spring of 2016. The value then remained stable from the spring of 2016 through October of 2016. There was then an upward trend in values from October 2016 through the second quarter of 2017. Values remained stable from the second quarter of 2017 to the fourth quarter of 2017 and saw a downward trend from the fourth quarter of 2017 to the third quarter of 2019. A slight up-tick occurred in the fourth quarter of 2019. Quarter 1 of 2020 shows a small dip, with Quarter 2 showing a larger dip. Quarters 3 and 4 show a rebound in price and volume. Quarter 1 and 2 of 2021 show a continued increase in price and a decrease in the number of auctions. Quarter 3 shows a slight decrease in price with an increased number of public auctions. The final quarter of 2021 shows the highest price and number of auctions. The overall trend has been relatively stable in recent years. The chart below illustrates these recent trends, and the data set includes farms that consist of 85%+ tillable acres and are sold through the public auction method.
Agriculture
Crop Insurance
Energy Management
Industry Insights
Land Auctions
Land Investment Expo
Land Management
Land Values
News & Events
Real Estate


Peoples Company proactively works to anticipate the needs of those in the agricultural sector. Our monthly email publication keeps readers in the know about everything land.
