In 2021 the U.S. rejoined The Paris Agreement, a legally binding international treaty on climate change, and published “The Long-Term Strategy of the United States, Pathways to Net-Zero Greenhouse Gas Emissions by 2050 [1]. Net zero refers to a balance between the amount of greenhouse gas (GHG) that is produced and the amount of GHG removed from the atmosphere. Agriculture accounts for approximately 10% of total GHG emissions in the U.S. [2]. This statistic often draws negative attention to agriculture, and by extension to farmland as an asset class. Specific sources of agricultural GHG emissions include methane from cattle production, nitrous oxide from nitrogen fertilizer and soil respiration, and are often identified as targets for regulatory action in efforts to reduce the overall carbon intensity of agriculture.
Achieving a net zero economy will require a fundamental shift in energy sources for every U.S. economic sector. This shift is referred to as the low carbon energy transition, or simply stated, a transition away from using fossil fuels as a primary energy source toward renewable energy production and low carbon intensity production such as nuclear power. Necessarily, much of the change in energy production methods will occur in agriculturally intensive regions and thus impact the use of farmland.
The conversation about transitioning to a low carbon energy economy has become politically charged with some asserting that it represents an existential threat and that any cost is justified, while others challenge the feasibility and cost-benefit results from efforts with unclear impact. In any case, current policy initiatives, and public and private investments have begun making major investments and commitments to monitor and reduce the carbon intensity of the energy sector.
The 2022 global investment into the low carbon energy transition exceeded $1.1T according to BloombergNEF (Figure 1) [3]. Many existing transition projects are facing challenges with increased costs of capital and it is not settled whether global economies will increase or decrease future spending, but the BloombergNEF analysis identified a need to increase that investment to an average of $4.55T annually over the remainder of the decade (Figure 2) to meet the global net zero objectives in The Paris Agreement. In any case, the purpose of this article is not to debate the merits of various proposals, but rather to evaluate the potential impact of net zero and low carbon energy transition investments on U.S. farmland over the next several decades.


Low Carbon Energy Transition
A fundamental component of low carbon energy transition is broad, cross-sector electrification using lower carbon intensity methods of power generation. Fossil fuel-based electricity generation is highly concentrated with energy resources transported to large-capacity generation plants and consumed to generate electricity along with the attendant GHG emissions. Renewable electricity generation is in most cases highly distributed - i.e. wind and solar generating capacity requires a large land footprint and generate relatively low output nodes across many locations. Evaluating the impact of the energy transition on farmland across different states and regions requires an accurate understanding about where those resources will be located. The data used for this evaluation come from the Net-Zero America Project (NZA) [4] led by researchers at Princeton University. The NZA is a collaboration between public and private organizations including funding provided by BP and ExxonMobil. The NZA developed a range of scenarios for achieving net zero goals, each assembled with unique constraints and assumptions. This evaluation uses the data produced from the NZA’s ‘High Electrification’ scenario. This scenario provides a framework to evaluate the impact of the necessary development of renewable energy across U.S. farmland while maintaining an economic balance with other energy supply options under the transition to Net Zero by 2050. Within that scenario, there are three low carbon energy transition resources discussed that have the potential to substantially impact U.S. Farmland.
Wind Energy: Naturally available wind resources have significant geographic overlap with the most intensely farmed regions of the U.S. Generally consistent topography and large areas with lower population density coupled with the natural available wind resource make the Corn Belt, Northern Plains, and Southern Plains regions particularly attractive for wind energy development projects. Turbine farms fully integrated into actively managed farmland are common across these regions.

Figure 3 provides a state-level summary of the wind generating capacity that would need to be installed by 2050 as identified in the NZA analysis. Establishing the wind generating capacity installed in each state provides the ability to estimate revenue streams created from the installations. Assuming that each turbine generates 2.75 MW, the annual initial lease rate for each turbine is $10,000, and the lease rate escalates annually by 2.5%, the revenue created in 2050 can be established for each state. One way to characterize the total economic value of the increased investment in wind generation is to apply a base market capitalization rate for the turbine revenue stream. In this case that capitalization rate is set at 8.0%. Figure 4 shows the implied financial value of the wind energy revenue streams by state under these assumptions with the total U.S. land value impact of nearly $130B. Several states in the Plains and Corn Belt in particular would receive the bulk of the increased revenue from wind energy generation.

Solar Energy: Installing solar generation panels over farmland presents a different challenge. When solar panels are installed on actively managed farmland, crops can no longer be grown and thus the offset production must also be accounted for in addition to the increased revenue associated with energy production. Fewer acres producing crops also reduces access to several economic benefits for farmland including crop insurance revenue protection, federal subsidy programs, inflationary influences, and long-term productivity gains. However, there are situations where converting farmland acres to solar production creates improved financial outcomes for the owners.
Solar lease rates vary across regions and current land use with examples ranging from $300-$2,000/acre depending on access, connectivity and sun suitability among other things. Lease rates at these levels can make solar installation financially attractive on farmland acres, particularly for acres that have crop productivity limitations. Examples of farmland with productivity limitations include irrigated farmland assets facing constraints on available water resources or assets with lower quality soils. These scenarios represent opportunities to achieve substantially higher future income streams from solar leases. Utilizing the analysis in the NZA, Figure 5 provides a summary of the solar installation acres by state in 2050 required to achieve net zero goals. These acres represent an opportunity to improve future income and value for farmland where solar installations present the best long-term financial outcome.

Biofuel production in the U.S. has expanded revenue sources for farmland through increased demand for feedstocks with the greatest impacts in the Corn Belt and Plains regions through the development of ethanol markets over the past two decades. The U.S. ethanol industry grew to 17.5 billion gallons of annual capacity in 2021 [5], representing over 80% of the current biofuels production capacity in the U.S. Further electrification of the passenger vehicle fleet will put downward pressure on current ethanol markets. At the same time, achieving the Net Zero goals will also require displacement of over 16 billion gallons annually of aviation fuel [6] and 45 billion gallons annually of diesel fuel [7] providing substantial opportunity for offsetting and increasing demand for feedstocks for production.
Technical pathways for biofuel production have been developed and massively improved over the past few decades. Achieving net zero goals will require further scaling and of these technologies to deliver low carbon liquid fuels to sectors that cannot feasibly electrify including aviation, heavy transport, and industrial uses. Emerging ethanol-to-jet fuel production pathways create opportunities to redirect existing biofuels production toward the large sustainable aviation fuel (SAF) market. Achieving net zero goals will create substantial additional demand of oilseed and cellulosic feedstocks to supply SAF and renewable diesel pathways. While it is difficult to explicitly project the impact of the resulting increased demand for feedstocks on regional farmland values, U.S. farmland will necessarily play a critical role in supplying the biomass feedstocks required to realize a net zero economy.
Carbon Storage
The U.S. Long-Term Strategy [2] identifies the ability of U.S. land to capture and store carbon as a critical component of achieving net zero goals. Carbon storage is required to achieve net zero because a subset of economic activities will be challenging, or even infeasible, to fully decarbonize. Offsetting the impact of these carbon emitting activities requires capturing and storing atmospheric carbon. Forest-based carbon markets are somewhat more developed with formalized carbon credits in offset markets regularly traded. Sequestering carbon in farmland provides more complex challenges than in forest settings due to difficulty in measuring and verifying additionality and permanence. Additionality relates to verification that the net additions to carbon sequestration was a direct result of the sale of an associated activity against which a carbon credit is linked. Permanence relates to the simple reality that management practices that can sequester carbon in annual production systems can also be reversed and release carbon that had previously been stored in the soil. The challenges of additionality and permanence have limited the development of farmland carbon markets and trades happening in these markets are often discounted or simply focus on payments for specific practice adoption without any verification of the carbon impact.
The carbon cycle in farmland soils is a complex process. Sophisticated models are required to simulate that complexity and forecast the impact of management practices on the carbon stored in farmland soils. This evaluation utilized the Carbon Reduction Potential Evaluation (CaRPE) tool to evaluate the carbon market opportunity for U.S. farmland [8]. CaRPE integrates data from USDA on farmland acreages by county and USDA’s COMET-Planner tool [9] then calculates soil carbon storage potential from implementing select soil conservation practices. This integrated framework factors in soil characteristics in a particular county to forecast how management practices such as cover crops impact carbon storage in those soils. The framework then applies that forecast across the range of soils and acreages in farmland in a given county to provide a projection of total soil carbon storage potential for the county.
Utilizing the result from this analysis, Figure 6 provides the state level carbon sequestration opportunity from the full implementation of no-tillage and cover cropping practices. There are incentive payments available from USDA and within several states to encourage the use of these practices as well as emerging incentives within federal crop insurance programs that encourage use of these and related conservation practices. The largest opportunities for carbon sequestration are in the Corn Belt, Delta, Northern Plains, and Southern Plains regions.

Evaluating the impact on farmland values from this revenue stream requires assumptions on the market value of the carbon and the capitalization rate for that income. Assuming a future stabilized value in farmland carbon markets of $50/tCO2e and a capitalization rate of 4.5% capitalization results in the values shown in Figure 7 for land value impacts by state. It is not yet clear how the land market will value carbon storage revenue streams. The assumption of a lower cap rate, 4.5%, than other revenue streams is based on two primary factors: 1) the practices that create carbon storage in farmland soils do not change the core land use and 2) food supply chains are putting pressure on farmland operators to adopt many of the same practices for sustainable supply chain initiatives. Utilizing these assumptions, the carbon storage income results in an aggregate potential value impact of nearly $224B for U.S. farmland.

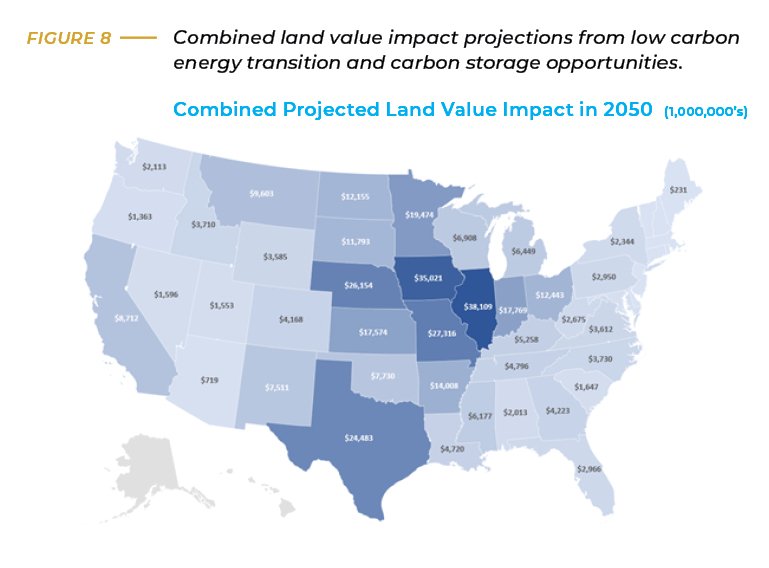
The combined impact of wind, solar, biofuels, and carbon storage represents a substantial opportunity for increased value creation in farmland. Figure 8 provides a forecast of the combined asset value creations from projected wind, solar, and carbon storage revenue streams by state as developed and discussed through this analysis. Table 1 shows the combined asset value opportunity aggregated by agriculture region.


References
1. https://www.whitehouse.gov/wp-content/uploads/2021/10/US-Long-Term-Strategy.pdf.
2. https://www.epa.gov/ghgemissions/sources-greenhouse-gas-emissions.
3. https://about.bnef.com/energy-transition-investment/#toc-report.
4. https://netzeroamerica.princeton.edu/about.
5. https://www.eia.gov/energyexplained/biofuels/ethanol-supply.php.
6. https://www.transtats.bts.gov/fuel.asp.
7. https://www.eia.gov/energyexplained/diesel-fuel/use-of-diesel.php.
8. https://carpe.shinyapps.io/CarpeTool/.
9. https://comet-planner.com/.


