

2026 Fertilizer Prices & Farm Profitability: A Nebraska Farm Management Perspective
Executive Summary
Fertilizer is one of the largest controllable costs in crop production, and its price has become far more volatile than many producers experienced a decade ago. The 2022 spike demonstrated how quickly global energy markets, export restrictions, war, transportation problems, and strong crop demand can change a farm budget.
Prices eased during 2023 and 2024, but the market did not return to the lower-cost environment that preceded 2021. In 2026, current price levels again underscore the importance of disciplined nutrient management. For this review, 2026 prices are shown at $890 per ton for MAP, $930 for DAP, $529 for 32% UAN, and $520 for ammonium sulfate (AMS).
2026 focus: higher nitrogen and sulfur prices are putting renewed pressure on corn margins.
For landowners, tenants, and farm managers, the issue is bigger than the fertilizer bill itself. Higher nutrient costs increase operating capital needs, influence cash-rent capacity, and raise the financial penalty for over-applying nutrients. The farms best positioned for the next cycle will be those that combine good agronomy with good purchasing, realistic yield goals, and careful cost-per-bushel analysis.
From Relative Stability to a New Era of Volatility
From roughly 2010 through 2019, fertilizer markets were comparatively predictable. Prices moved, but most annual budgets could absorb the change. Beginning in 2020, that pattern broke down. COVID-era manufacturing disruptions and shipping delays were followed by rising natural-gas costs and tighter global supplies.
The Russia-Ukraine war then intensified uncertainty in energy, ammonia, and crop-input markets. At the same time, export restrictions and freight constraints magnified regional shortages. By 2022, MAP and DAP exceeded $1,000 per ton in many Midwest markets, while liquid nitrogen costs moved sharply higher.
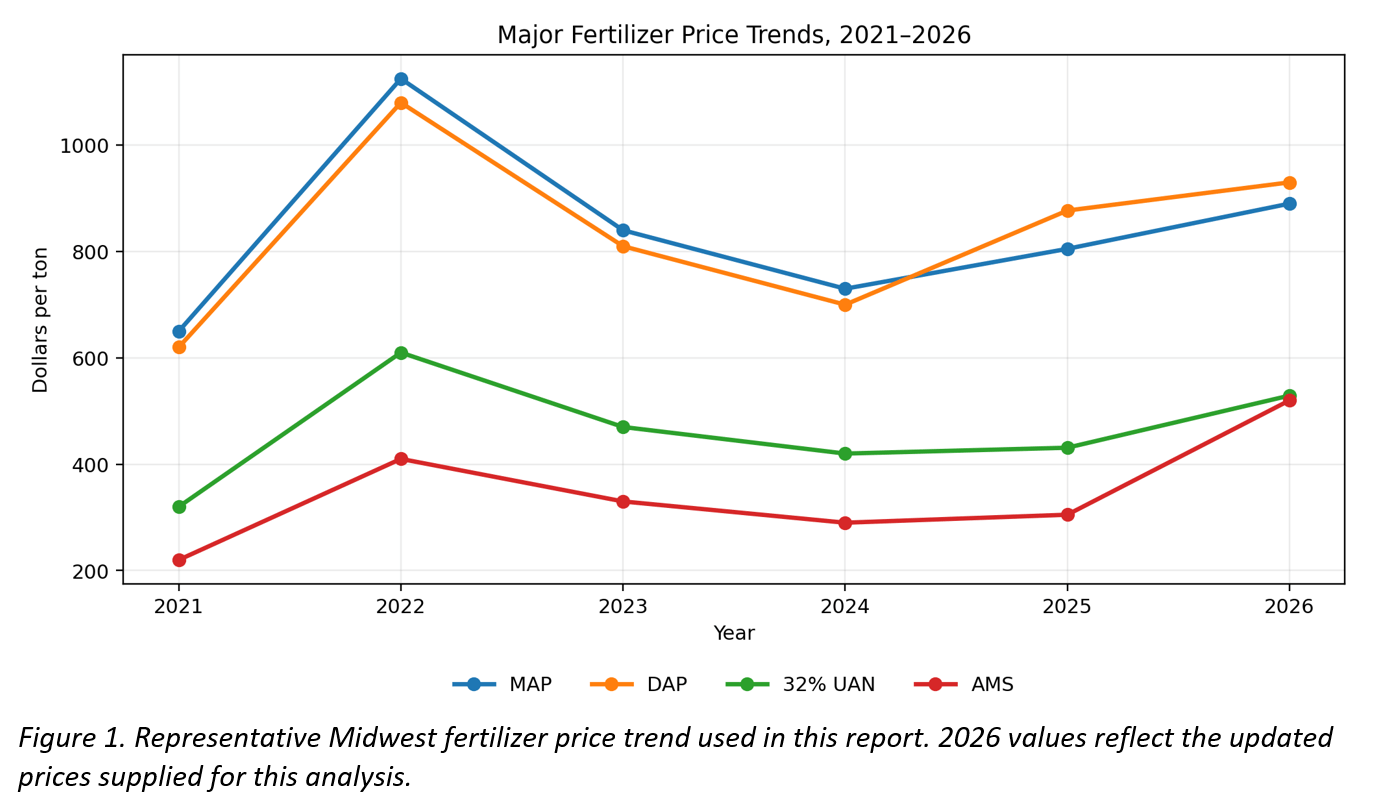
The chart highlights two important points. First, 2022 was an extraordinary peak. Second, a decline from the peak does not mean fertilizer is inexpensive. The updated 2026 figures show that 32% UAN and especially AMS have strengthened materially from 2025 levels.
Why Fertilizer Prices Move
Nitrogen Follows Energy
Nitrogen fertilizer is closely linked to natural gas because gas is the primary feedstock and energy source used in ammonia production. When gas is cheap and production is running smoothly, nitrogen can be competitive. When energy costs rise or plants shut down, fertilizer prices can change quickly.Phosphate and Sulfur are Global Markets
MAP and DAP depend on phosphate rock, ammonia, sulfur, processing capacity, and international trade. Concentrated production means policy changes or export restrictions in a major producing country can affect U.S. prices. AMS adds another layer because it provides both nitrogen and sulfur, and sulfur demand has grown as crop-removal rates and yield expectations have increased.Transportation and Timing Matter
Fertilizer is bulky and expensive to move. River levels, rail service, barge freight, terminal inventories, and spring weather can all create local price premiums. The same product can therefore carry a very different delivered price depending on location and time of year.Grain Prices Influence Demand
When corn prices are strong, growers are more willing to protect yield potential and fertilizer demand tends to remain firm. When crop prices weaken, growers scrutinize rates more closely. The adjustment, however, is rarely immediate because fertilizer supply chains are planned months in advance.
The fertilizer market is global, but the financial consequences are local—one farm budget and one field at a time. |
Updated 2026 price snapshot
Product | 2026 price/ton |
MAP | $890 |
DAP | $930 |
32% UAN | $529 |
AMS | $520 |
What Higher Fertilizer Costs Mean for the Farm Economy
For an irrigated Nebraska corn operation, fertilizer can represent one of the largest variable-cost categories. The effect is especially severe when crop prices soften at the same time nutrient prices rise. A farm can produce an excellent crop and still generate a disappointing return if the cost structure is too high.
The cost-per-acre line is not intended to represent every farm. Actual cost depends on soil-test levels, crop rotation, credits from previous crops or manure, yield goal, product mix, and application strategy. It does illustrate the economic pressure created when several nutrients rise together.
Effects beyond the Fertilizer Bill
Higher input costs increase operating loan requirements and interest expense. They can delay machinery replacement and other capital projects. They also affect land economics: when expected crop margins shrink, the amount a tenant can sustainably pay in cash rent eventually comes under pressure.
For landowners, this is why rent discussions should consider more than headline grain prices. A strong lease is one that allows the farm to remain productive, well-maintained, and financially sustainable over multiple crop cycles.
Managing Fertilizer Risk and Looking Ahead
There is no single strategy that eliminates fertilizer-price risk, but several management practices can reduce exposure and improve nutrient efficiency.
Use current soil tests and realistic yield goals. Applying nutrients to outdated assumptions can be expensive when fertilizer is high.
Evaluate fertilizer on a cost-per-bushel basis, not only a cost-per-acre basis. The lowest acre cost is not always the most profitable program.
Use variable-rate technology where field variability justifies it. Moving nutrients from low-response areas to high-response areas can improve return on investment.
Consider split nitrogen applications and in-season tools when they fit the operation. Flexibility can reduce the risk of committing the entire nitrogen budget before the crop develops.
Spread purchasing decisions across the year when practical. Attempting to pick one perfect buying day can create unnecessary exposure.
Protect working capital. In a volatile input environment, liquidity is a management tool.
What to Expect Next
The most reasonable expectation is continued volatility rather than a return to the very stable fertilizer markets of the 2010s. Natural gas, global politics, shipping, export policy, and crop prices will continue to influence the market. The updated 2026 values - particularly $529 per ton for 32% UAN and $520 for AMS - are a reminder that individual products can strengthen quickly even when the broader fertilizer complex remains below a previous record.
Final Thoughts
Fertilizer should be treated as an investment in profitable production, not simply as an expense to be minimized. The goal is not the highest possible yield or the lowest possible fertilizer bill.
The goal is the best economic return while maintaining the long-term productivity of the soil.
For producers, landowners, and farm managers, achieving that balance requires sound agronomy, disciplined input purchasing, realistic yield expectations, honest lease discussions, and accurate recordkeeping. As fertilizer costs remain elevated and input markets continue to fluctuate, management decisions have an increasingly significant impact on both annual profitability and the long-term value of a farm asset. In an era of higher costs and tighter margins, management excellence matters more than ever.
Our Peoples Company Land Management team works alongside landowners and operators to evaluate farm performance, monitor input decisions, and help ensure every acre is managed with both profitability and stewardship in mind. From lease oversight and budgeting to agronomic coordination and long-term planning, we help landowners make informed decisions that protect and enhance the value of their investment. If you would like to discuss your farm's performance or explore opportunities to improve returns while preserving long-term productivity, visit our service page or contact us at [email protected].
Data note: 2021–2025 figures are representative Midwest values used for trend illustration. 2026 MAP, DAP, 32% UAN, and AMS prices reflect the updated values used in this report. The $320/acre 2026 fertility figure is a representative estimate, not a farm-specific budget.
Agriculture
Crop Insurance
Energy Management
Growing Together
Industry Insights
Land Auctions
Land Management
Land Values
News & Events
Real Estate




Peoples Company proactively works to anticipate the needs of those in the agricultural sector. Our monthly email publication keeps readers in the know about everything land.
