Is Organic Farmland Worth More?

Overall Organic Market
Total U.S. Organic (Food and Non‐Food) Sales has been on the rise for at least the last decade, according to the Organic Trade Association, which publishes an annual Organic Industry Survey. While consumer demand has spurred organic farming, questions revolving around profitability, certification, difficulty in farming, risk, and organic farmland values have remained center stage.
The chart below displays Total U.S. Organic Sales and Growth, 2012‐2021.
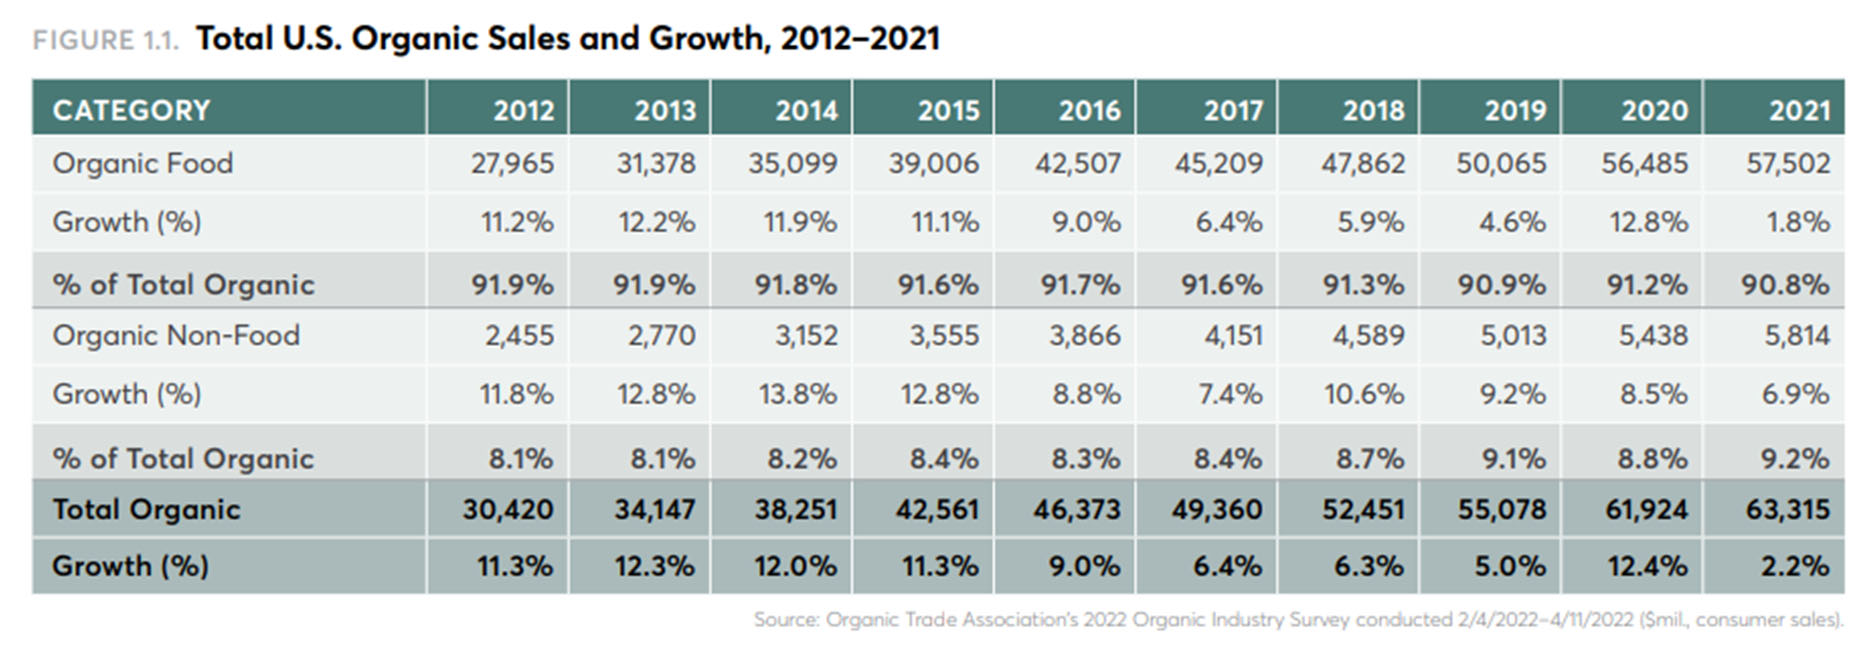
Source: Organic Trade Association’s 2022 Organic Industry Survey.
At face value, it appears the overall organic market is growing at robust and steady levels; All signs point to growth.
The 2021 total organic sales in the U.S. are reported at $63,315 million, which is up roughly 2.2% from the 2020 figure of $61,924 million. When comparing 2012 to 2021, total organic annual sales in the U.S. had more than doubled. Growth on an annual basis between 2012 and 2021 ranges from 2.2% to 12.4% and averages 8.8% annually. Of the 10‐years reported, five years indicate double‐digit growth, while the remainder indicate single‐digit growth.
When analyzed as a percentage of market‐share of total food sales in the U.S., organic food sales over the 10‐year span ranged from 4.1% to 6.4% annually and average 5.6% annually.
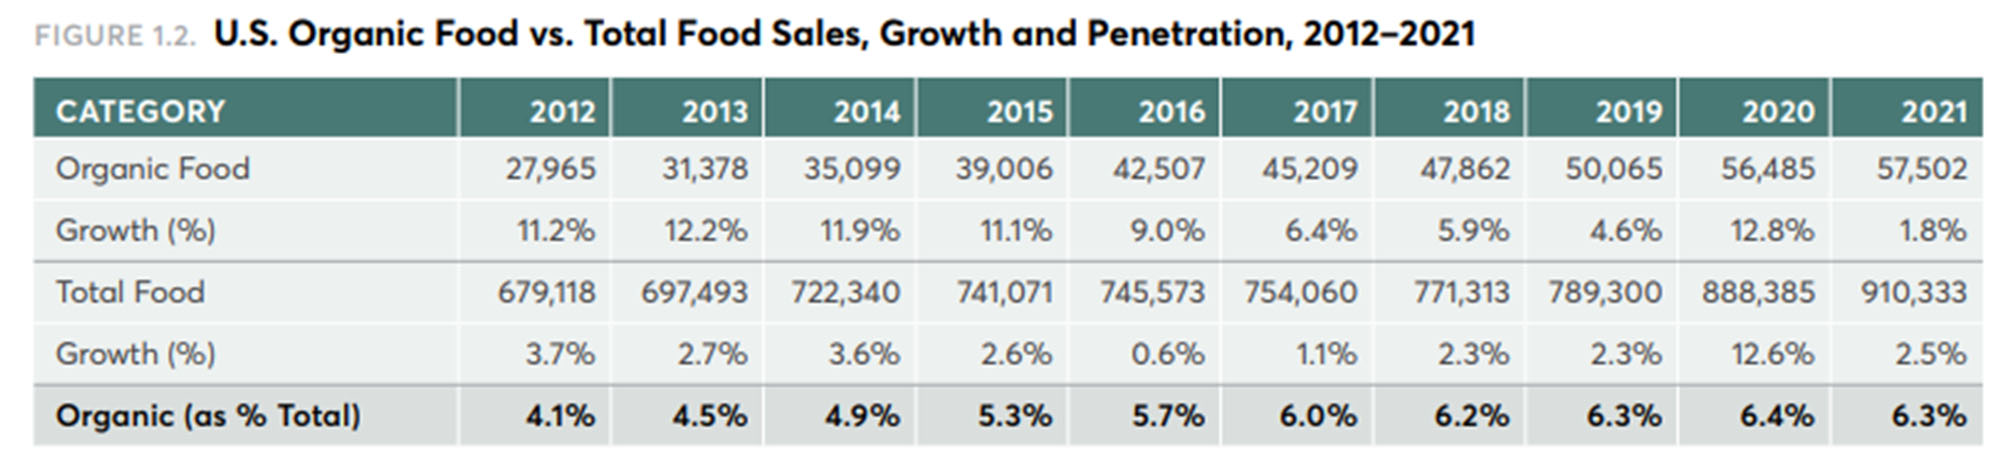
Source: Organic Trade Association’s 2022 Organic Industry Survey.
The percentage of organic food sales has generally increased over the 10‐year span, suggesting consumers are increasingly demanding organic food options.
Despite the fluctuations, the positive year‐over‐year growth suggests consumers are staunch on organic products and the market is here to stay. However, much like recent “inflationary” pressure in the market, organic sales can be broken down into many categories, some of which do not display the same robust growth.
Organic Market Breakdown
U.S. organic food‐sales‐by‐product are broken down into: Fruit & Vegetables, Beverages, Dairy & Eggs, Packaged & Prepared foods, Breads & Grains, Snack Foods, Condiments, and Meat/Poultry/Fish.
U.S. organic non‐food sales by product are broken down into: Supplements, Fiber (Linen & Clothing), Personal Care, Pet Food, Household Products, and Flowers.
Let’s look at the largest segment of 2021 U.S. organic food sales by product ‐ fruit and vegetables. Coming in at 37.1% of organic food sales in 2021, fruit and vegetables is far‐and‐away the largest market segment; in second place and third place, in terms of sales, is beverages at 14.3% and dairy and eggs at 12.8%, respectively.
Over the 10‐year period, fruit and vegetable sales growth ranged from 4.4% to 15.1% annually, and average 9.1% annually. This category maintained a growth rate of 4.4% in 2021, slightly lower than the 4.7% growth rate in 2019. Fruit and vegetables maintained growth over the 10‐year period. This is true for other organic food sales categories, but not for all.
When analyzing organic food sales growth in the U.S., it is clear most categories show growth over the 10‐year period, and only recently have some categories declined.
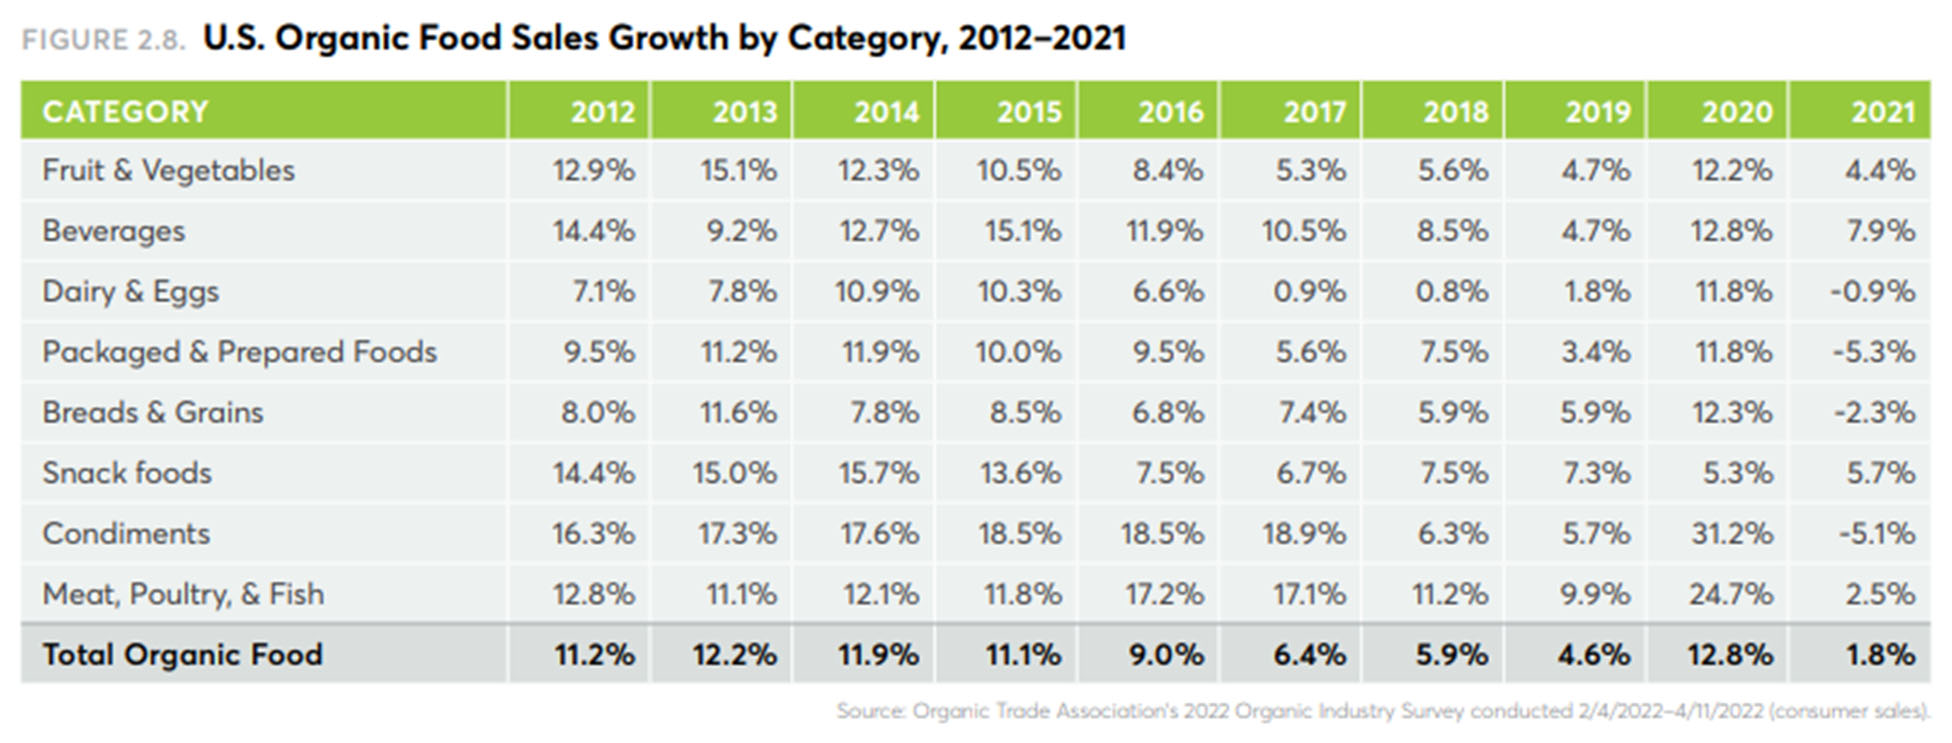
Source: Organic Trade Association’s 2022 Organic Industry Survey.
The most recent year reported, 2021, has dealt with obvious economic struggles relating to Covid‐19 and it could be deemed that certain organic market segments are more sensitive to constrained disposable incomes; in other words, consumers can do without certain organic products if the money is simply not available to purchase them. All‐in‐all, the organic submarkets show growth, and it is deemed ‘too early to tell’ if the decline witnessed in 2021 is a trend.
Organic Farming Opportunity and Risk
The demand for organic food has brought into the spotlight an opportunity for farmers and investors alike to either operate or invest in an organic farm. Organic farming is attractive to most in‐that the organic crop yields often command a higher price point than their respective non‐organic counterpart. While the revenue a farm can generate by being organic is appealing, certain drawbacks and risk considerations need to be vetted prior to venturing into the organic space.
From an owner/user standpoint, converting a traditional farm to organic will likely result in a loss of income in the first few years as the owner works through the certification process. One must be in it for the long‐haul. Furthermore, it is imperative to zero‐in on the crops that will be grown. This is vastly important. An owner will want to minimize downside risk of a more delicate farming operation that organic farming commands. Items such as adequate farm drainage, topography, access to water, controlling water, annual precipitation, climate conditions, hard ‘winter‐kill’, timeliness of applications, and higher input costs (organic fertilizers, etc.) should be well thought‐out and considered. Additional considerations include a higher level of management, soil health, cover crops, and crop rotation.
From an investors standpoint to reduce/minimize risk, it is imperative to consider who is taking on the risk of maintaining the assets organic ‘certification’. In one instance, it is appealing to be able to charge a higher cash rent to a tenant, but if the ‘certification’ is not upheld, that cash rent is not a durable source of income, and risk is apparent. Relatively speaking, the market for a tenant that can work through the challenges organic farming brings, is likely smaller than the market for a traditional or ‘non‐organic’ tenant. This presents another risk consideration.
The emphasis of risk is apparent in ‘organic’ operations. Let’s look below at how risk can affect the perception of value for an organic farm compared to a traditional (non‐organic) farm.
Example – Organic v. Non‐Organic Farm
The example below is provided to help represent how an appraiser can break down the performance of a farm to ultimately value the farm via the Income Capitalization Approach. While the U.S. is vast in terms of agricultural commodities, climates, and growing regions, the propensity for a successful organic farm can vary significantly. In this instance, we take a farm that is already certified organic and is operating as an organic farm versus a traditional (non‐organic) farm. For analysis purposes the farms are entirely the same, yet one if organic and one is not.
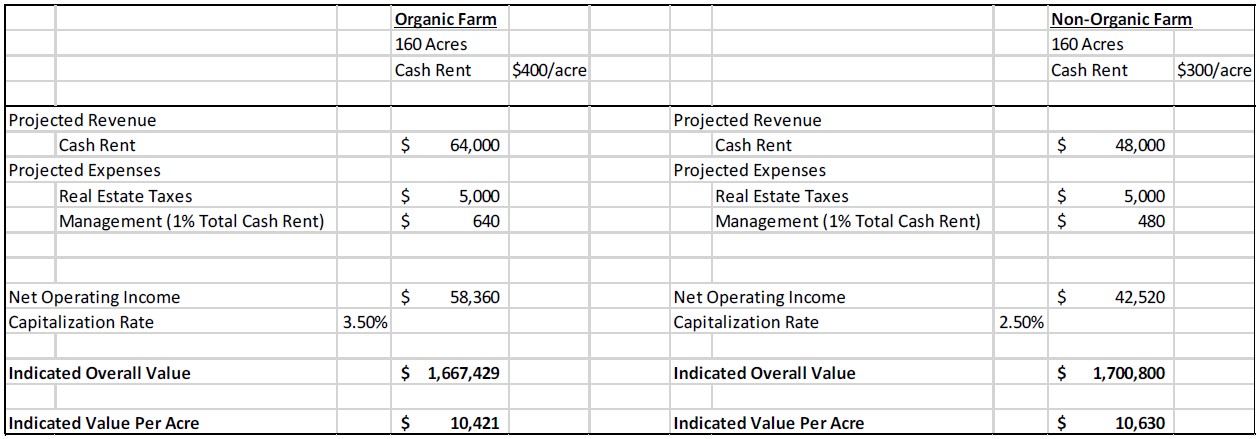
Source: Peoples Company.
Due to the anticipated higher price point yields grown on the organic farm, the cash rent is higher: $400 for the organic farm compared to $300 for the non‐organic farm;
The real estate expense is the same;
Management expense in both cases is 1% of total projected cash revenue;
Net operating income for the organic farm is higher than net operating income for the non‐organic farm, largely due to the higher rental revenue generated.
The income approach (direct capitalization method) to value is achieved by dividing an assets net operating income by a capitalization rate. In theory Value = Net Operating Income / Capitalization Rate or V = I/R.
If the organic farm generates more income, than why is its concluded value similar/on‐par with the nonorganic farm value?
The answer lies within the selection of the capitalization rate or cap rate. Implicit in the definition of cap rate is that it is a measure of risk. Cap rates can be derived from sales of assets that are leased, whereby the appraiser can take actual income/expense data and sale price information to derive net operating income and go on to derive a cap rate. Support for a cap rate is also provided by industry surveys/reports, market respondents (investors) and via a built‐up method. Cap rates derived from sales of organic farming operations are sparse. As such, proper analysis of the ‘risk’ level associated with an organic farm is essential to proper valuation.
The built‐up method considers an investment alternative such as the 10‐year treasury rate, which at the current time is 3.9%. An investor can choose to invest in a 10‐year treasury at a rate of 3.9% yet forgoes liquidity over the 10‐year term. Current market conditions suggest agricultural assets carry less risk comparatively because they are more liquid and could be sold at any time; thus, reducing risk. Furthermore, for this example, let’s assume traditional farm assets in the market trade at cap rates ranging from 2.0% to 2.5%. Given the perceived increased risk based on all factors around organic farming, the perception is that a cap rate premium would need to be considered, over and above cap rates for traditional farms. It is this level of risk analysis that ultimately determines how a cap rate is reconciled for use in the income approach.
The example presented above capitalizes (measures risk) for the organic farm 1% or 100 basis points higher than the non‐organic farm. Thus, despite the increased rental revenue achieved by the organic farm, the resulting overall value and value per acre suggest the two farms are ‘worth’ about the same in the open market.
It is understood that the example presented is essentially in a vacuum and utilized for analysis purposes only. Given the variability or crop prices, differences in climates, and knowledge of farming practices, an organic farm could potentially carry a value premium in its respective market; on the flip side it could carry a price discount.
Peoples Company employs an appraisal staff well versed in the valuation of agricultural assets. The team covers a wide range of agricultural market across the United States and has achieved several of the highest‐level designations in the industry. If you are interested in discussing the value of your agricultural asset, please reach out to Appraisal@PeoplesCompany.com or call 855.800.5263.
Agriculture
Crop Insurance
Energy Management
Industry Insights
Land Auctions
Land Investment Expo
Land Management
Land Values
News & Events
Real Estate
Peoples Company proactively works to anticipate the needs of those in the agricultural sector. Our monthly email publication keeps readers in the know about everything land.
