
Introduction to Soil Productivity Indexes
Soil productivity indexes are among the most valuable tools for classifying farmland. These indexes offer a consistent way to measure agricultural land. Soil types and characteristics can vary significantly not just from one region to another, but between neighboring properties. While no two farms are ever truly identical, assigning a soil productivity index allows for comparison on a clear numerical scale that all market participants can understand.
Common Soil Productivity Indexes
Corn Suitability Rating (CSR2)
Developed by Iowa State University, the primary soil rating used in Iowa measures a soil’s productivity specifically for corn production, using a scale that ranges from 5 to 100.
Crop Productivity Index (CPI) or Productivity Index (PI)
The rating system utilized across Minnesota, North Dakota, and South Dakota. Each state relies heavily on USDA Natural Resources Conservation Service soil data and implements state-specific adjustments. Minnesota places emphasis on corn production, North Dakota bases its index on hard red spring wheat, and South Dakota is a multi-crop model. The scale ranges from 0-100.
Illinois Soils Productivity Index (ILPI)
Developed at the University of Illinois, this scale ranges from 47–147. It is common practice to further categorize properties into soil classes A through C.
Weighted Average Productivity Index (WAPI)
The preferred index of the state of Indiana is based on dryland corn production.
National Crop Commodity Productivity Index (NCCPI)
This index is utilized as the nationwide standard across all regions and dryland crops. This system is not intended to be used in place of state-specific ratings.
It is important to note that soil productivity indexes are not interchangeable between states; an 80 CSR2 farm in Iowa is not equivalent to an 80 CPI in Minnesota. The exception is the NCCPI, as its intended use is as a nationwide standard.
Applications for Soil Productivity Indexes
When all properties in a dataset are evaluated using the same standardized scale, each property can be accurately compared and further analyzed. A few application examples include: use in county tax assessment, conservation program eligibility, rental rate estimation, farm management decisions, and arguably most important, market analysis.
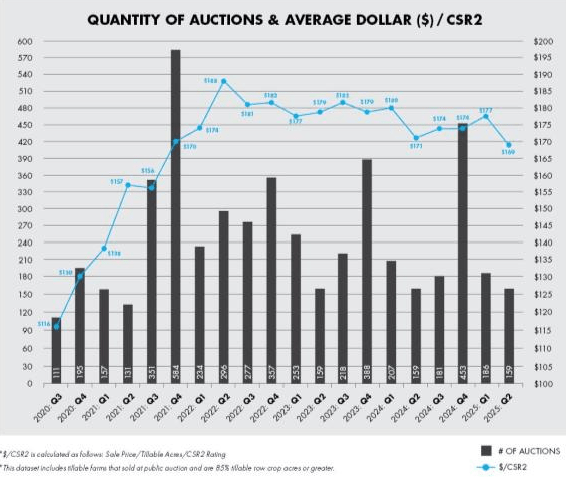
A common valuation metric used in Iowa market analysis is the dollar per CSR2 point ($/CSR2). This metric is calculated by taking the total property sale price, dividing it by the number of tillable acres, and then dividing that result by the CSR2 value of the tillable acres. (Sale Price ÷ Tillable Acres) ÷ CSR2 = $/CSR2 Point
Peoples Company’s appraisal team tracks and analyzes every land auction in the state of Iowa. Below is a chart tracking the average dollar per CSR2 over the past five years.
Conclusion and Final Thoughts
It is necessary to clarify that a soil's productivity index is NOT the sole determining factor of the value of the property. Furthermore, it is NOT a measure of the soil's fertility, but rather the soil's potential. Properties with lower soil index ratings can, and on occasion do, outperform higher-rated tracts in both sale price and crop production. The bottom line is that a soil rating is a guide, not a guarantee, and should be weighed with other agronomic and economic considerations.
The relationship between soil rating and property performance is inherently open-ended, shaped by variables that cannot be fully captured within an index. As land markets, commodity prices, and agronomic practices continue to evolve, interpreting soil data in isolation provides only a partial view. For a more complete understanding of value and opportunity, consult with a land professional at Peoples Company to ensure your decisions are grounded in both data and context.
Agriculture
Crop Insurance
Energy Management
Industry Insights
Land Auctions
Land Investment Expo
Land Management
Land Values
News & Events
Real Estate


Peoples Company proactively works to anticipate the needs of those in the agricultural sector. Our monthly email publication keeps readers in the know about everything land.
