Agricultural Real Estate Market - 2022 Year Review and 2023 Outlook

Macro-economic factors drive real estate markets, and over the last 24 months, several of these factors have shown significant changes. Let’s take a deeper dive into commodity prices (specifically corn and soybean), input costs (specifically fertilizer), inflation, and the U.S. Discount Rate. For each category, data will be presented along with a key takeaway.
Boots on the ground categories are presented via analysis of the USDA 2022 Land Survey, the Q4 2022 NCREIF Farmland Index, and comments from certified general appraisers at Peoples Company.
Commodity Prices
Data
The charts below identify a 3-year trend line for the futures spot prices of Corn and Soybean. These charts are referenced via the Chicago Board of Trade, Barchart.com.
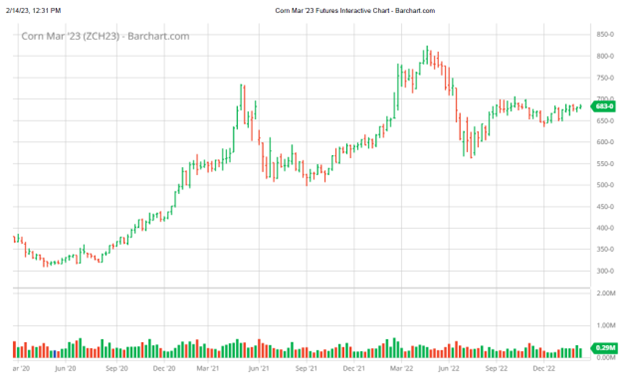
Corn futures are currently trading at $6.83 per bushel. The chart above indicates a strong run up in price starting circa June 2020 and peaking circa June 2022. The chart above indicates that corn futures have remained relatively stable since March 2021. The chart also indicates the corn futures price since June 2020 is well above the price it was historically trading.
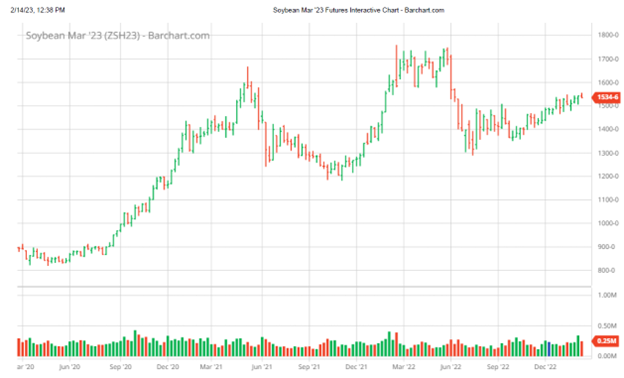
Soybean futures are currently trading at $15.34 per bushel. The chart above indicates a strong run up in price starting circa September 2020 and peaking circa March 2022. The chart above indicates that soybean futures have remained relatively stable since March 2021. The chart also indicates the soybean futures price since March 2021 is well above the price it was historically trading.
Takeaway
This drastic increase in futures prices, albeit over a fairly short period of time, directly increases the revenue generated on a row crop farm that is in corn and soybean rotation. This increase in price has resulted in an increase in farmland values and an increase in cash rent charged to a tenant to farm the property.
The drastic increase in corn and soybean futures is primarily attributed to the war in Ukraine, increased demand for food to curb food scarcity resulting from the COVID-19 pandemic, and a drastic increase in the amount of U.S. currency in circulation. All events have transpired over the last 24-36 months, and all are largely out of the control of a typical property owner.
The events are arguably rare occurrences; as such, the volatility of this macro-economic indicator comes into question. Will corn and soybean futures prices cool down soon to more stable (historical average) levels? How long will the futures prices remain elevated above their more normalized levels?
Amongst the macro-economic factors mentioned in this blog, I believe commodity prices can have the largest impact on agricultural real estate value moving forward.
Input Costs
Data
The chart below identifies the average weekly retail UAN32 price for 2021, 2022, and 2023; it also identifies the 5-year average price. The data is sourced from DTN.com.
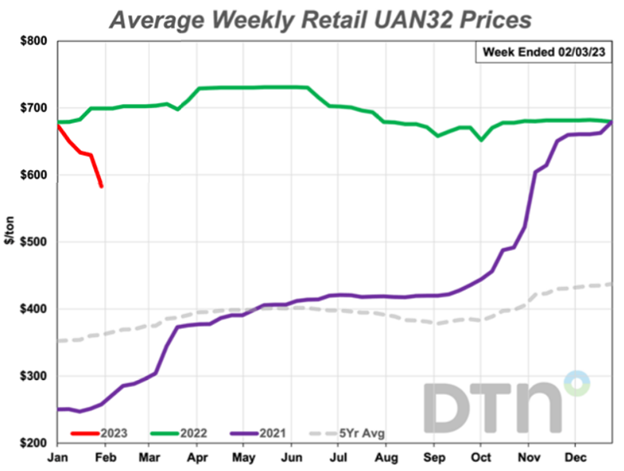
As of the week ending February 3, 2023, the average retail price of UAN32 was just under $600. This price is well above the 5-year average of roughly $360. However, it is below the 2022 trendline suggesting input prices have come down somewhat. The recent downward trend in price is likely attributable to the fulfillment of pent-up demand and the smoothing of logistical challenges that peaked during the height of the COVID-19 pandemic. The price will likely stay elevated into the near future (above the 5-year average) given strong farmer demand, the crisis in Ukraine, and the large amount of cash injected into the U.S. economy.
Takeaway
Input costs are essentially a fixed cost in any farming operation. They are directly related to the production of a commodity. While there is some variability/strategy to securing input costs for less, the costs remain elevated and are directly affecting the profitability of a farm operation. The key to input costs is that commodity prices have also remained high, suggesting the increase in revenue produced by a farming operation would offset the increase in input costs. In other words, you take the good with the bad. The recent slight decline in input costs will help expand the net operating income margin of a farming operation.
While input costs have a large impact on farming operations, current and forecasted commodity prices are top of mind. Input prices should continue to cool down as inflationary pressure continues to trend downwards and as supply chain challenges continue to ease.
Inflation and U.S. Discount Rate
Data
The charts below identify the inflation trendline in the United States over the last 10 years and the inflation trendline over the last 12 months. The charts were sourced from Tradingecomomics.com; U.S. Bureau of Labor Statistics.
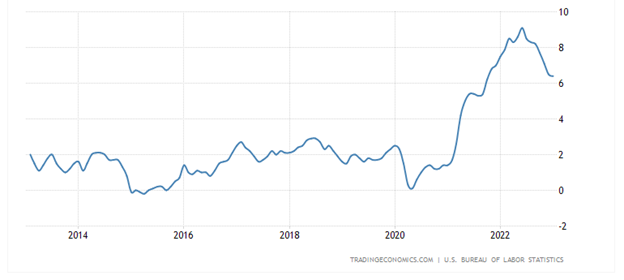
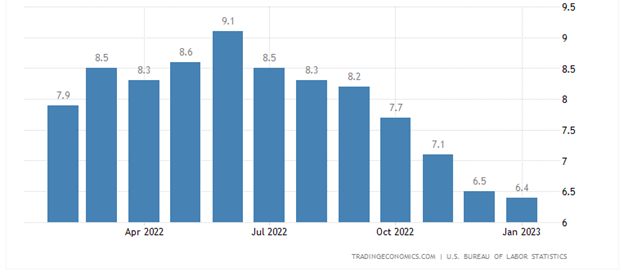
The U.S. inflation rate peaked in June 2022 at 9.1% and is currently at 6.4%. The inflation rate in the U.S. slowed for the seventh straight month since June 2022. The decline can be directly attributed to the increase in the U.S. Discount Rate. Currently inflation is well above the rate witnessed between 2013 and 2020 at roughly 2%. A 2% inflation rate is considered a target rate for the Federal Reserve.
The chart below displays the U.S. Discount Rate over a 3-year period. The chart is sourced from YCharts.com.

Takeaway
The spike in inflation can be directly attributed to the United States’ response to the COVID-19 impact via monetary policy. Relief programs significantly increased the amount of U.S. currency in circulation, thus increasing demand/purchasing power. This spike in demand created supply demands and price increases. The delays/logistical challenges of materials/products resulting from the crisis in Ukraine further exacerbated the price run up in the form of supply and demand disparity. Furthermore, the U.S Discount Rate offered by the Federal Reserve was still historically low prior to Q2 2022 which allowed borrowers to borrow at low rates, thus fueling the demand.
The primary takeaway involving inflation is one method upon which the Federal Reserve reduces monetary supply, by increasing the U.S. Discount Rate. By increasing this rate, bank rates for consumer loans are increased, thus increasing the cost of borrowing funds to acquire real estate. This single metric has already displayed negative effects on residential and commercial markets across the country. However, the agricultural market is insulated relatively well compared to the residential and commercial markets. In other words, the agricultural market is a relatively low-leverage asset class. As such, the Federal Reserve’s tactic of reducing inflation, and the resulting higher borrowing rates, will likely have less of an impact on the farmland real estate market compared to input costs and commodity prices.
USDA Land Values 2022 Summary
The chart below identifies average cropland value in the U.S. from 2008-2022 in dollars per acre.
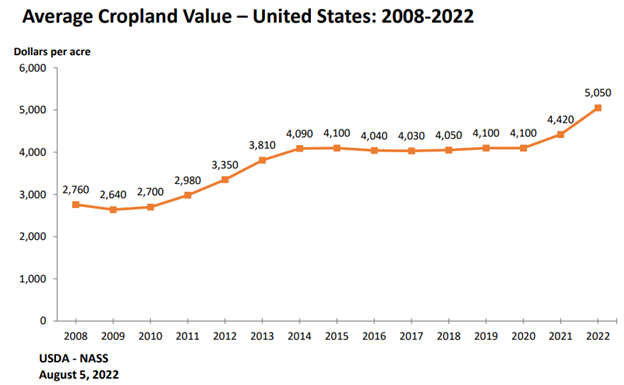
The USDA reports that average cropland value increased once again from 2021 to 2022. The average cropland value in 2022 is $5,050 per acre, up 14.3% from 2021; $4,420. The increase in value in 2022 indicates the second consecutive year of increase. Values were relatively stable from 2014 to 2020.
The chart below itemizes the 2022 cropland value by state in terms of dollars per acre and percent change from 2021. The states color coded with deeper red indicate statewide average acre values above $8,000, while beige indicates statewide average acre value of $2,600 or less.
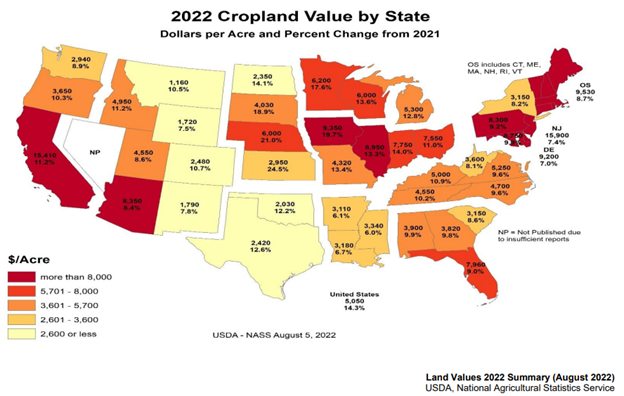
The strongest submarkets within the country appear to be the Lake States, Corn Belt, Pacific Northwest, and California. Note that multiple states indicate a double digital increase in cropland values from 2021 to 2022.
Q4 NCREIF Farmland Property Index
The chart below identifies 1-10, 15, and 20-year annualized returns, as well as returns since inception for total farmland in the index. It also breaks down by property type subindexes: annual cropland and permanent cropland.
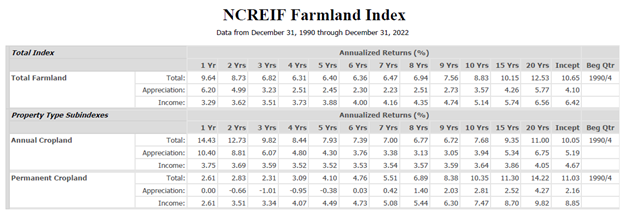
The total farmland index realized a 1-year annualized return of 9.65%, slightly above the 2-year annualized return of 8.73%. The annualized return since inception is 10.65%. The farmland index includes 1,315 properties with a market value of $15,282M. The index began in Q4 1990.
Boots on the Ground
Interviews with several Certified General real estate appraisers at Peoples Company suggest the following:
Emily Oberbroeckling is a Certified General appraiser at Peoples Company. She is licensed in Iowa and Wisconsin. She is located in Northeast Iowa –
“2022 was another peak year in the land market in Iowa. There were a lot of land sellers who took advantage of the overall rising tide in Northeast and Eastern Iowa, but not as strong as some land sales reported in Northwest Iowa. We did witness some no-sales or struggling at public auctions to meet the 'minimum' on the lower quality, riskier properties (e.g., flood potential, sandier farms etc.), but they usually sold directly after the sale. Rising interest rates are slowing down the bank (appraisal) requests, but we're hearing there is still a lot of cash on the market for the right farm in the right neighborhood. 2023 will continue to be a test on interest rates and I think we're going to see more listings and private sales to help balance the active land market! Is there going to be a dip? Good question, better ask your neighbor to see how much cash they have left after buying crop inputs...”
Mark Van Den Berg is a Certified General appraiser at Peoples Company. He is licensed in Michigan, Colorado, Florida, Illinois, and South Carolina. He is located in Michigan’s ‘thumb region’ of the Lower Peninsula.
“Looking into 2023, I see land values backing down slightly between local and regional buyers, due to the higher cost of borrowing for real estate and operating loans. Higher input prices, when compared to previous years, and higher interest rates on operating loans will change the focus of producers to manage cost in the short term compared to expansion. An exception to this will be if a producer has the option to purchase a property near their operation, which may not hit the open market for the next ten to thirty years. If inflation begins to slow and the Federal Reserve begins to lower interest rates, I can see land sales picking back up again in the third and fourth quarters of 2023.
On the opposite side, I see cash buyers, such as large landowners with cash reserves or institutional investors continuing to purchase prime agricultural tracts as a hedge against inflation and as a safe alternative to the volatility we have seen in the stock market over the past three years.”
Mark Williams is a Certified General appraiser at Peoples Company. He is licensed in Michigan, Indiana, Ohio, Texas, Iowa, Nebraska, Montana, Minnesota, and Tennessee. He is located in Michigan’s ‘thumb region’ of the Lower Peninsula.
“Across the Midwest the ag market experienced increases never seen before in cropland demand and prices. Although in the past 60 years there have been similar sharp increases in demand/prices, they never reached the heights seen in the 2021-22 ramp up. The three factors that drove the 2021-22 feeding frenzy are like the past surges in the market. They were a combination of high commodity prices, low to moderate input costs and low interest rates. Due to increased value in cropland and record profits, landowners were not only cash flush but flush in equity. The result is, they may have replaced some equipment, but most of that wealth was reinvested back into land and combined with a supply shortage, it drove record prices. If we look at history, these surges are short lived, and the market began to experience that in early 2022 as inputs rose sharply and followed by interest rates. Sales declines typically lag drops in profits and increases in interest rates, however the market began to experience the impact of increase in inputs and sharp rise in interest rates in the 4th quarter of 2022. Going forward into 2023 we can expect to see prices holding steady or maybe slight increases in prime cropland, while the demand and value for marginal cropland to experience a decline and it may be sharp in some markets. The stay on the top of the market is short lived. The unknown factor is the volatility in the market caused by input and fuel costs going forward.”
Kristen Halbur is a Certified General appraiser at Peoples Company. She is licensed in Iowa. She is located in west-central Iowa.
“The 2023 growing season will soon be underway. Crop insurance prices will be set soon, and with lower price volatility than a year ago we can expect similar prices to 2022 levels. This will set a floor for breakeven and profits, helping to guarantee another successful year for operators. There are many unknowns about the recently released PARP government program, but even sequestered payments to farmers would add to profitability in 2023. Despite high inputs, equipment costs and interest rates, profitability in 2023 is projected to be stable. While the demand for good quality land is high and profits continue to be stable, land values will hold steady and are likely to continue to rise in some areas.”
Note – the comments suggested by the author and contributory appraisers at Peoples Company are not to be perceived as pre-conceptions regarding future value trends in the market. Appraisers abide by the Uniform Standard of Professional Appraisal Practice (USPAP). As such, they provide market supported opinions of value based on real time data and analysis. Some-but-not-all metrics that appraisers could consider were presented in this blog article.
Agriculture
Crop Insurance
Energy Management
Industry Insights
Land Auctions
Land Investment Expo
Land Management
Land Values
News & Events
Real Estate
Peoples Company proactively works to anticipate the needs of those in the agricultural sector. Our monthly email publication keeps readers in the know about everything land.
