NCREIF Farmland Property Index 2020 3rd Quarter Results
The National Council of Real Estate Investment Fiduciaries (NCREIF) has collected institutional commercial property investment performance on a quarterly basis for over 40 years. The Farmland Index measures the investment performance of a large pool of individual farmland properties acquired in the private market for investment purposes only.
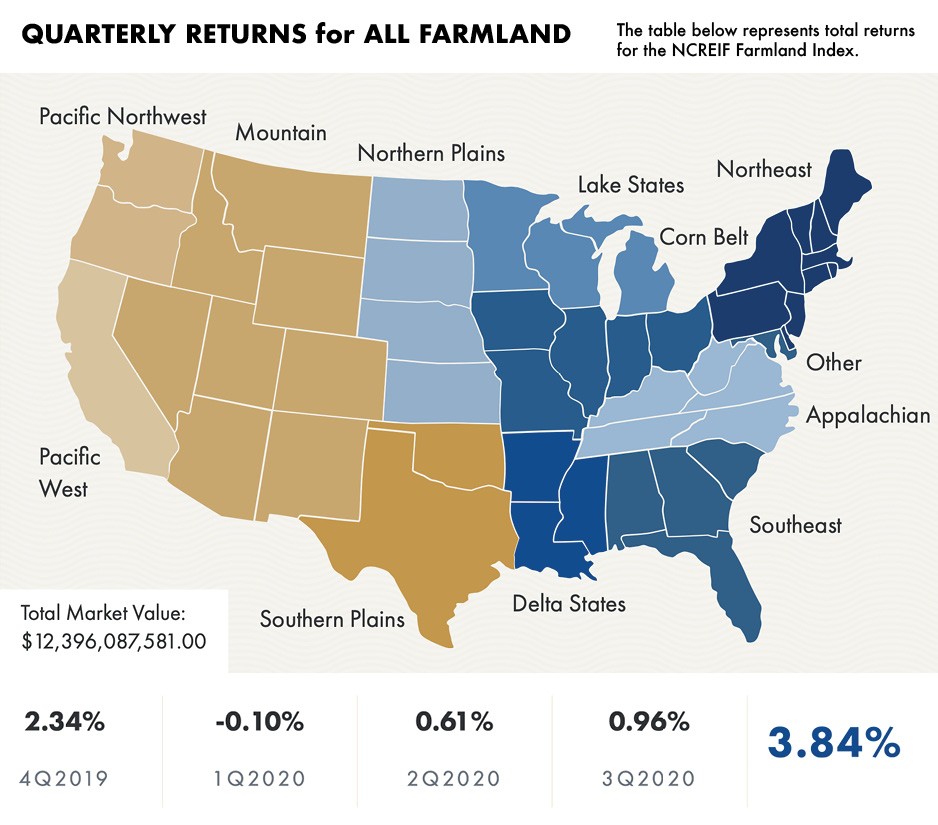
NCREIF recently released the third-quarter results of the Farmland Index for 2020. The top-performing regions for Annual Crops this quarter were the Pacific West and the Southern Plains, producing returns of 3.77% and 2.46%, respectively, for the quarter. For Permanent Crops, the Pacific West Region provided the top return of 0.91% for the quarter.
As of September 30, 2020, the market value of the index was $12.4 billion in farmland across the U.S., consisting of $7.5 billion in annual cropland and $4.9 billion in permanent cropland, across 1,194 assets. Annual cropland reported a total return of 4.05%, and permanent cropland reported a total return of 3.55%.
The largest region by market value is the Pacific West at $4.9 billion. The region is exclusive to the state of California and consists mainly of permanent cropland (almonds, pistachios, wine grapes, and walnuts).
The largest annual cropland region is the Delta States at $2.4 billion, followed by the Corn Belt at $1.3 billion.
Peoples Company is excited to expand our reach to provide top performance for landowners in all regions. Our dedicated team of appraisal professionals and consultants have the skills, experience, and resources to provide the most accurate property valuation available. To inquire about conducting an appraisal or retaining the services of a professional licensed consultant, contact Peoples Company at 855.800.5263 today or email Appraisal@PeoplesCompany.com for additional information.
|
4Q19 |
1Q20 |
2Q20 |
3Q20 |
Total Return |
|
|
All Farmland |
2.34% |
-0.10% |
0.61% |
0.96% |
3.84% |
|
Permanent Cropland (Total) |
3.86% |
-1.35% |
0.26% |
0.80% |
3.55% |
|
Annual Cropland (Total) |
1.44% |
0.66% |
0.82% |
1.07% |
4.05% |
|
Pacific Northwest - All Farmland |
2.57% |
-0.60% |
1.07% |
-0.37% |
2.67% |
|
Pacific Northwest - Permanent Cropland |
1.74% |
-0.74% |
1.25% |
0.15% |
2.41% |
|
Pacific West - All |
3.53% |
-1.24% |
-0.04% |
1.38% |
3.61% |
|
Pacific West - Permanent Cropland |
4.06% |
-1.59% |
-0.16% |
0.91% |
3.17% |
|
Pacific West - Annual Cropland |
0.94% |
0.55% |
0.60% |
3.77% |
5.94% |
|
Mountain States - All |
1.63% |
0.94% |
0.23% |
1.16% |
4.00% |
|
Southern Plains - Annual (All) |
1.45% |
2.10% |
1.04% |
2.46% |
7.23% |
|
Lake States - All (Majority Annual) |
3.21% |
-0.57% |
0.92% |
1.13% |
4.74% |
|
Corn Belt - Annual (All) |
1.89% |
0.14% |
0.97% |
1.39% |
4.45% |
|
Delta States - Annual (All) |
0.99% |
1.47% |
1.00% |
0.34% |
3.85% |
|
Southeast - Annual Cropland |
1.17% |
0.91% |
1.23% |
1.05% |
4.43% |
|
Southeast - Permanent Cropland |
2.38% |
1.36% |
6.23% |
-0.76% |
9.40% |

Agriculture
Crop Insurance
Energy Management
Industry Insights
Land Auctions
Land Investment Expo
Land Management
Land Values
News & Events
Real Estate

Peoples Company proactively works to anticipate the needs of those in the agricultural sector. Our monthly email publication keeps readers in the know about everything land.
